- Analytics
- News and Tools
- Market News
- Gold Price Forecast: $1791 appears a tough nut to crack for XAU/USD bulls – Confluence Detector
Gold Price Forecast: $1791 appears a tough nut to crack for XAU/USD bulls – Confluence Detector
- Gold price extends previous gains, with eyes again on the $1791 level.
- Gold bulls defy the uptick in the USD, as Treasury yields pare gains.
- Gold: Sellers defend $1,800, all eyes on US T-bond yields.
Gold price is holding the higher ground, extending the previous advance amid a pullback in the US 10-year Treasury yields from five-month highs of 1.672%. However, with the risk-off mood seeping back into the market, amid mixed European corporate earnings, the US dollar is finding its feet across the board, which could likely cap the upside in gold price. In absence of the first-tier US economic data, the broader market sentiment will continue to lead the way while investors will closely follow the price action in the yields and the dollar.
Read: Gold Price Forecast: XAU/USD’s bullish potential appears limited amid bear cross, firmer yields
Gold Price: Key levels to watch
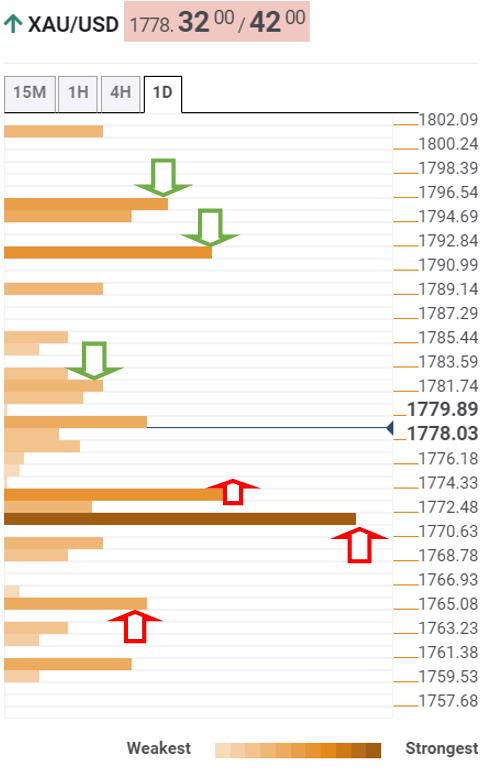
According to the Technical Confluences Detector, gold eyes a smooth sail towards the Fibonacci 23.6% one-week at $1789.
However, a bunch of minor resistance levels stacked up around $1783 could challenge the bullish attempts. That zone is the confluence of the Fibonacci 38.2% one-week, pivot point one-day R1 and Fibonacci 23.6% one-day.
The crucial upside target at $1791 still remains on gold buyers’ radars. That level is the intersection of the Fibonacci 61.8% one-month and Bollinger Band one-hour Upper.
Sellers will then need to the defend $1795, which is the convergence of the SMA100 and 200 one-day.
On the flip side, strong support awaits at $1774, the point where the previous low four-hour coincides with the SMA10 four-hour.
The confluence of the SMA200 four-hour, Fibonacci 61.8% one-day and SMA50 four-hour at $1771 will be the level to beat for gold bears.
The next downside target is envisioned at the Fibonacci 38.2% one-month at $1766.
Here is how it looks on the tool
About Technical Confluences Detector
The TCD (Technical Confluences Detector) is a tool to locate and point out those price levels where there is a congestion of indicators, moving averages, Fibonacci levels, Pivot Points, etc. If you are a short-term trader, you will find entry points for counter-trend strategies and hunt a few points at a time. If you are a medium-to-long-term trader, this tool will allow you to know in advance the price levels where a medium-to-long-term trend may stop and rest, where to unwind positions, or where to increase your position size.


© 2000-2026. All rights reserved.
This site is managed by Teletrade D.J. LLC 2351 LLC 2022 (Euro House, Richmond Hill Road, Kingstown, VC0100, St. Vincent and the Grenadines).
The information on this website is for informational purposes only and does not constitute any investment advice.
The company does not serve or provide services to customers who are residents of the US, Canada, Iran, The Democratic People's Republic of Korea, Yemen and FATF blacklisted countries.
Making transactions on financial markets with marginal financial instruments opens up wide possibilities and allows investors who are willing to take risks to earn high profits, carrying a potentially high risk of losses at the same time. Therefore you should responsibly approach the issue of choosing the appropriate investment strategy, taking the available resources into account, before starting trading.
Use of the information: full or partial use of materials from this website must always be referenced to TeleTrade as the source of information. Use of the materials on the Internet must be accompanied by a hyperlink to teletrade.org. Automatic import of materials and information from this website is prohibited.
Please contact our PR department if you have any questions or need assistance at pr@teletrade.global.
transfers