- Analytics
- News and Tools
- Market News
- Gold Price Forecast: XAU/USD key levels to watch as US yield curve flattens – Confluence Detector
Gold Price Forecast: XAU/USD key levels to watch as US yield curve flattens – Confluence Detector
- Gold price consolidates the two-day recovery, as the US yield curve flattens.
- All eyes on Thursday’s critical ECB and US GDP data for the next big move in gold.
- Gold bears and bulls fight over $1,800, focus shifts to US GDP.
Spiking short-term US Treasury yields amid increasing bets of Fed’s monetary policy normalization, in the face of strengthening economic recovery, leading to the flattening of the yield curve. As the yield curve flattens, it also re-ignites stagflation fears amid the persistence of rising price pressures globally, which is possibly keeping the buoyant tone intact around the traditional safe-haven gold price. However, gold bulls remain cautious and refrain from placing any fresh bets ahead of the key event risks for this week.
Read: Gold Price Forecast: Risks appear skewed to the upside for XAU/USD heading into ECB, US GDP
Gold Price: Key levels to watch
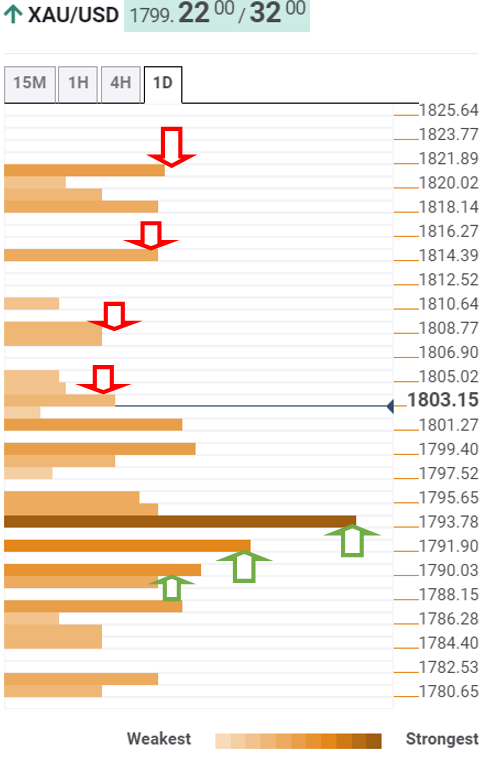
The Technical Confluences Detector shows that gold is retreating after having faced rejection at $1804, the previous high four-hour.
At the press time, gold price is battling $1800, the confluence of the previous day’s high and the SMA5 four-hour.
If the selling pressure intensifies, the next relevant support is seen around $1793, where the SMA200, Fibonacci 38.2% one-day and one-week merge.
Further south, the Fibonacci 61.8% one-month at $1791 will play out, below which the convergence of the SMA100 one-day and Fibonacci 61.8% one-day at $1789 will be challenged.
On the upside, gold buyers will need acceptance above the aforesaid $1804 resistance level. The buyers will then target the pivot point one-day R2 at $1809.
Fresh buying opportunities above the latter will seek a test of the previous week’s high of $1814.
Further up, the bulls will then challenge a dense cluster of resistance levels around $1820, which is the intersection of the pivot point one-day R3, pivot point one-month R1 and pivot point one-week R1.
Here is how it looks on the tool
About Technical Confluences Detector
The TCD (Technical Confluences Detector) is a tool to locate and point out those price levels where there is a congestion of indicators, moving averages, Fibonacci levels, Pivot Points, etc. If you are a short-term trader, you will find entry points for counter-trend strategies and hunt a few points at a time. If you are a medium-to-long-term trader, this tool will allow you to know in advance the price levels where a medium-to-long-term trend may stop and rest, where to unwind positions, or where to increase your position size.


© 2000-2026. All rights reserved.
This site is managed by Teletrade D.J. LLC 2351 LLC 2022 (Euro House, Richmond Hill Road, Kingstown, VC0100, St. Vincent and the Grenadines).
The information on this website is for informational purposes only and does not constitute any investment advice.
The company does not serve or provide services to customers who are residents of the US, Canada, Iran, The Democratic People's Republic of Korea, Yemen and FATF blacklisted countries.
Making transactions on financial markets with marginal financial instruments opens up wide possibilities and allows investors who are willing to take risks to earn high profits, carrying a potentially high risk of losses at the same time. Therefore you should responsibly approach the issue of choosing the appropriate investment strategy, taking the available resources into account, before starting trading.
Use of the information: full or partial use of materials from this website must always be referenced to TeleTrade as the source of information. Use of the materials on the Internet must be accompanied by a hyperlink to teletrade.org. Automatic import of materials and information from this website is prohibited.
Please contact our PR department if you have any questions or need assistance at pr@teletrade.global.
transfers