- Analytics
- News and Tools
- Market News
- AUD/USD struggles at 0.7550 amid risk-on market sentiment
AUD/USD struggles at 0.7550 amid risk-on market sentiment
- AUD/USD advances in the session, despite rising US T- bond yields.
- The US dollar weakens, weighed on by a slower rise in Q3 GDP.
- US Initial Jobless Claims rose to 281K, less than the 290K expected, improving for the third consecutive week.
The AUD/USD edges higher during the New York session, up 0.50%, trading at 0.7554 at the time of writing. Since Tuesday, the pair remained trapped around the 0.7490-0.7535 area, failing to gain traction either way. However, worse than expected US GDP figures for the third quarter spurred a sell-off of the greenback
In the Asian session, the AUD/USD traded near the daily lows, around 0.7480, due mainly to a mild risk-off environment. Investors ignored a tad that Australian inflationary figures rose sharply to the upside on Wednesday, increasing market participants’ bets of a possible rate hike by the Reserve Bank of Australia.
However, a slower than expected US economic growth boosted the AUD/USD pair, coupled with an upbeat market sentiment portrayed by US stocks edging higher, propelled the AUD/USD reaching a daily high at 0.7555.
In the meantime, the US Dollar Index, which measures the greenback’s performance, collapses 0.6%, down to 93.30, despite rising US T-bond yields with the 10-year benchmark note up to three basis points, sitting at 1.561%.
US Gross Domestic Product for Q3 expanded by 2%, worse than the 2.7% foreseen, the US dollar weakens
On the macroeconomic front, the US Gross Domestic Product for Q3 increased by 2%, lower than the 2.7% estimated by analysts. Moreover, the Federal Reserve’s favorite measure of inflation, the Personal Consumption Expenditure, remained high, expanding by 4.5% in the Q3, after a 6.1% bounce in the prior three months.
Nevertheless, there was a positive in the day. The US Initial Jobless Claims rose to 281K, lower than the 290K expected by analysts, dropping for the third consecutive week. Despite recent disappointments on the US Nonfarm Payrolls report, the labor market shows some signs of coming back to life.
Meanwhile, US Home Pending Home sales declined by 2.3% for September on a monthly basis, following the August reading that witnessed an increase of 8.31%, as reported by the US National Association of Realtors
AUD/USD Price Forecast: Technical outlook
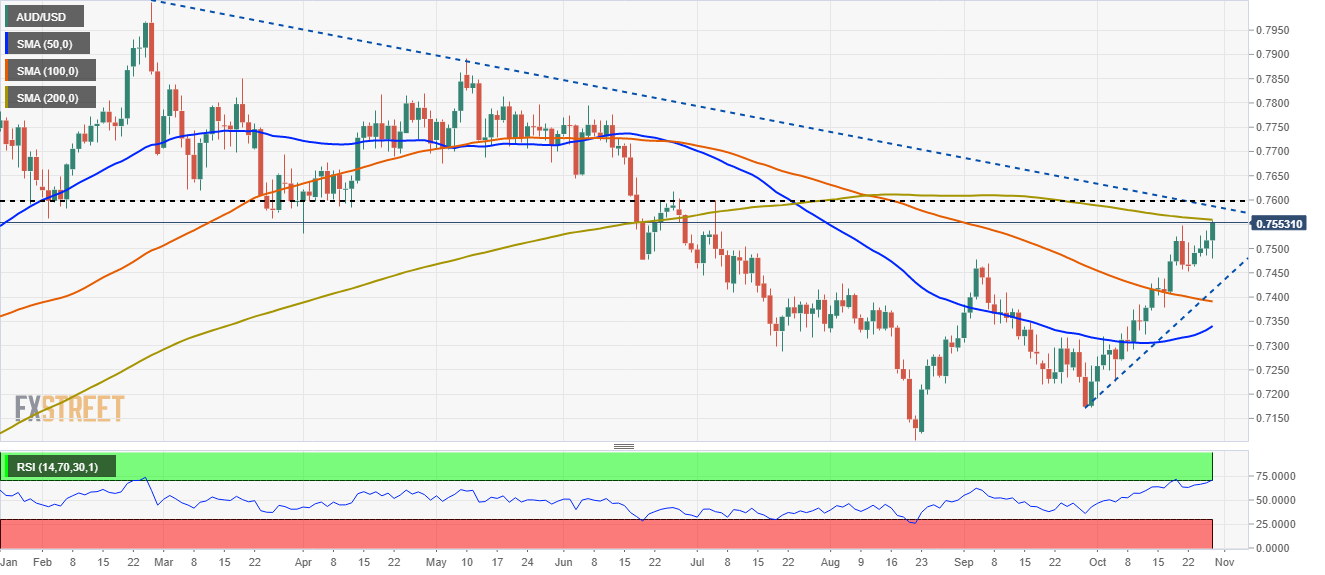
The daily chart depicts the AUD/USD has printed an upside break above 0.7550 but is facing strong resistance, at the 200-day moving average (DMA), which lies at 0.7560. The Relative Strength Index (RSI), a momentum indicator is at 71 inside overbought levels, coupled with the 200-DMA, could potentially exert downward pressure on the pair, so it is worth notice for AUD/USD traders.
Nevertheless, a daily close above the latter could open the way for 0.7600, that confluences with a six-month downslope falling trendline, that would oppose strong resistance.
Therefore, an upside break is on the cards, but caution is warranted as signals of potential price exhaustion lie ahead.


© 2000-2026. All rights reserved.
This site is managed by Teletrade D.J. LLC 2351 LLC 2022 (Euro House, Richmond Hill Road, Kingstown, VC0100, St. Vincent and the Grenadines).
The information on this website is for informational purposes only and does not constitute any investment advice.
The company does not serve or provide services to customers who are residents of the US, Canada, Iran, The Democratic People's Republic of Korea, Yemen and FATF blacklisted countries.
Making transactions on financial markets with marginal financial instruments opens up wide possibilities and allows investors who are willing to take risks to earn high profits, carrying a potentially high risk of losses at the same time. Therefore you should responsibly approach the issue of choosing the appropriate investment strategy, taking the available resources into account, before starting trading.
Use of the information: full or partial use of materials from this website must always be referenced to TeleTrade as the source of information. Use of the materials on the Internet must be accompanied by a hyperlink to teletrade.org. Automatic import of materials and information from this website is prohibited.
Please contact our PR department if you have any questions or need assistance at pr@teletrade.global.
transfers