- Analytics
- News and Tools
- Market News
- Gold Price Forecast: XAU/USD eyes $1,869 and $1,873 on road to recovery – Confluence Detector
Gold Price Forecast: XAU/USD eyes $1,869 and $1,873 on road to recovery – Confluence Detector
- Gold price rebounds from $1,850 key support as yields pullback.
- Gold remains unfazed by the Fed tightening calls after strong US data.
- Gold capitalizes on inflation fears, buyers look to retain control.
Gold price is staging an impressive rebound on Wednesday, having found strong support at the midpoint of the $1,800 level. The renewed upside in gold price comes on the back of a retreat in the US Treasury yields, which has taken the wind out of the dollar’s rally to 16-mnoth highs. Markets remain risk-averse amid growing concerns over inflation, adding to upturn in the inflation hedge, gold. In absence of first-tier US economic data, the dynamics in the yields and the dollar will continue to influence gold price alongside a slew of Fedspeak.
Read: Gold Price Forecast: XAU/USD pullback points to a fresh upswing towards $1,900?
Gold Price: Key levels to watch
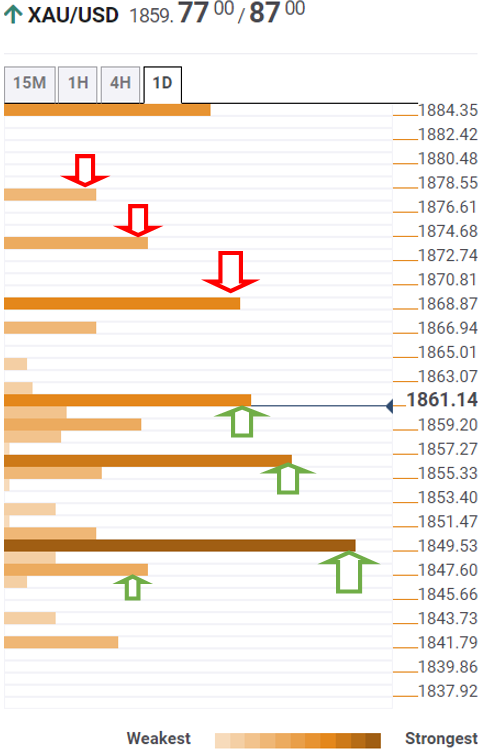
The Technical Confluences Detector shows that gold price is eyeing a sustained move above $1,861, which is the convergence of the Fibonacci 38.2% one-day, SMA10 four-hour and SMA100 one-hour.
The next significant upside barrier for gold buyers is seen at $1,869, where the previous week’s high and pivot point one-day R1 coincide.
Acceptance above the latter will expose the Bollinger Band one-day Upper at $1,873, above which the previous day’s high of $1,877 will get challenged.
Alternatively, a firm break below $1,857, the confluence of the Fibonacci 23.6% one-day and one-week, will reinforce the recent bearish momentum towards the pivot point one-month R2 at $1,850.
Minor support of the Fibonacci 38.2% one-week at $1,847 will be the next stop for gold bears.
Here is how it looks on the tool
About Technical Confluences Detector
The TCD (Technical Confluences Detector) is a tool to locate and point out those price levels where there is a congestion of indicators, moving averages, Fibonacci levels, Pivot Points, etc. If you are a short-term trader, you will find entry points for counter-trend strategies and hunt a few points at a time. If you are a medium-to-long-term trader, this tool will allow you to know in advance the price levels where a medium-to-long-term trend may stop and rest, where to unwind positions, or where to increase your position size.


© 2000-2026. All rights reserved.
This site is managed by Teletrade D.J. LLC 2351 LLC 2022 (Euro House, Richmond Hill Road, Kingstown, VC0100, St. Vincent and the Grenadines).
The information on this website is for informational purposes only and does not constitute any investment advice.
The company does not serve or provide services to customers who are residents of the US, Canada, Iran, The Democratic People's Republic of Korea, Yemen and FATF blacklisted countries.
Making transactions on financial markets with marginal financial instruments opens up wide possibilities and allows investors who are willing to take risks to earn high profits, carrying a potentially high risk of losses at the same time. Therefore you should responsibly approach the issue of choosing the appropriate investment strategy, taking the available resources into account, before starting trading.
Use of the information: full or partial use of materials from this website must always be referenced to TeleTrade as the source of information. Use of the materials on the Internet must be accompanied by a hyperlink to teletrade.org. Automatic import of materials and information from this website is prohibited.
Please contact our PR department if you have any questions or need assistance at pr@teletrade.global.
transfers