- Analytics
- News and Tools
- Market News
- Gold Price Forecast: $1,800 holds the key for XAU/USD amid rallying yields – Confluence Detector
Gold Price Forecast: $1,800 holds the key for XAU/USD amid rallying yields – Confluence Detector
- Gold price remains at the mercy of the Treasury yields’ price action.
- Markets are now pricing in four Fed rate hikes this year; Powell, US inflation eyed.
- Gold 2022 Outlook: Correlation with US T-bond yields to drive yellow metal.
Gold is struggling to find a clear directional bias so far this Monday, having staged an impressive bounce from three-week lows. The US Treasury yields resume the rally triggered by the Fed rate hike frenzy, lifting the dollar alongside at gold’s expense. Amid a lack of top-tier economic releases on Monday, gold price will remain at the mercy of the price action in the yields. The focus remains on Fed Chair Jerome Powell’s testimony and US inflation due later this week for a decisive move in gold price.
Read: Gold Price Forecast: Risks appear skewed to the downside, eyes on Powell, US inflation
Gold Price: Key levels to watch
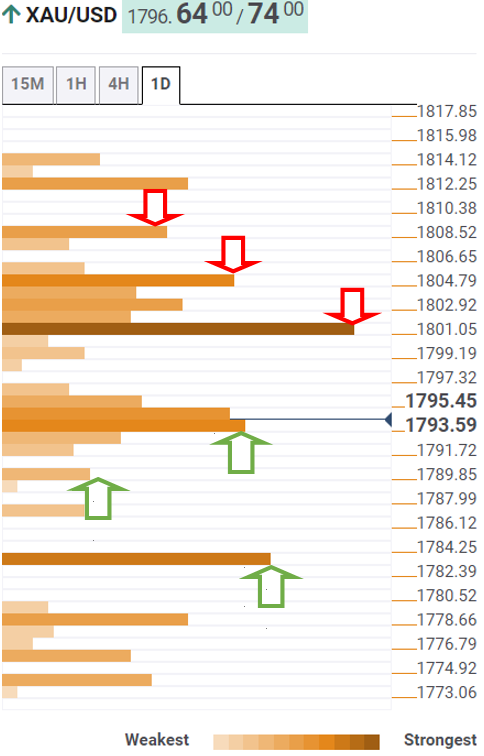
The Technical Confluences Detector shows that the gold price is pressuring a strong support at $1,793 once again, which is the convergence of the SMA100 one-day and Fibonacci 38.2% one-day.
The Fibonacci 61.8% one-day at $1,789 will guard the downside, below which sellers will gear up to test the previous day’s low at $1,783.
On the flip side, if the bulls find acceptance above the $1,800 mark, then the resumption of the previous recovery cannot be ruled out.
That level is the confluence of the SMA200 one-day, Fibonacci 38.2% one-month and one-week.
Further up, the intersection of SMA100 four-hour and SMA50 one-day at $1,805 will be a tough nut to crack for gold bulls.
The next relevant upside target is pegged at $1,809, where the pivot point one-day R2 meets with the SMA10 one-day.
Here is how it looks on the tool
About Technical Confluences Detector
The TCD (Technical Confluences Detector) is a tool to locate and point out those price levels where there is a congestion of indicators, moving averages, Fibonacci levels, Pivot Points, etc. If you are a short-term trader, you will find entry points for counter-trend strategies and hunt a few points at a time. If you are a medium-to-long-term trader, this tool will allow you to know in advance the price levels where a medium-to-long-term trend may stop and rest, where to unwind positions, or where to increase your position size.


© 2000-2026. All rights reserved.
This site is managed by Teletrade D.J. LLC 2351 LLC 2022 (Euro House, Richmond Hill Road, Kingstown, VC0100, St. Vincent and the Grenadines).
The information on this website is for informational purposes only and does not constitute any investment advice.
The company does not serve or provide services to customers who are residents of the US, Canada, Iran, The Democratic People's Republic of Korea, Yemen and FATF blacklisted countries.
Making transactions on financial markets with marginal financial instruments opens up wide possibilities and allows investors who are willing to take risks to earn high profits, carrying a potentially high risk of losses at the same time. Therefore you should responsibly approach the issue of choosing the appropriate investment strategy, taking the available resources into account, before starting trading.
Use of the information: full or partial use of materials from this website must always be referenced to TeleTrade as the source of information. Use of the materials on the Internet must be accompanied by a hyperlink to teletrade.org. Automatic import of materials and information from this website is prohibited.
Please contact our PR department if you have any questions or need assistance at pr@teletrade.global.
transfers