- Analytics
- News and Tools
- Market News
- Gold Price Forecast: XAU/USD bulls remain poised to test $1,831 and $1,837 – Confluence Detector
Gold Price Forecast: XAU/USD bulls remain poised to test $1,831 and $1,837 – Confluence Detector
- Gold bulls take a breather before resuming the post-US inflation uptrend.
- US inflation confirms a March Fed rate hike, DXY traders ‘sell the fact’.
- Gold 2022 Outlook: Correlation with US T-bond yields to drive yellow metal.
Gold price is consolidating near weekly highs, as the US dollar attempts a bounce in tandem with the Treasury yields this Thursday. The greenback got smashed on ‘sell the fact’ trading after the 7% rise in the US annualized inflation in December cemented a March Fed rate hike, which was almost priced in by the market. Despite the pullback in gold price, the upside bias remains intact, courtesy of a bullish technical setup on the daily chart.
Read: US Consumer Inflation Soars: Federal Reserve March rate hike looms
Gold Price: Key levels to watch
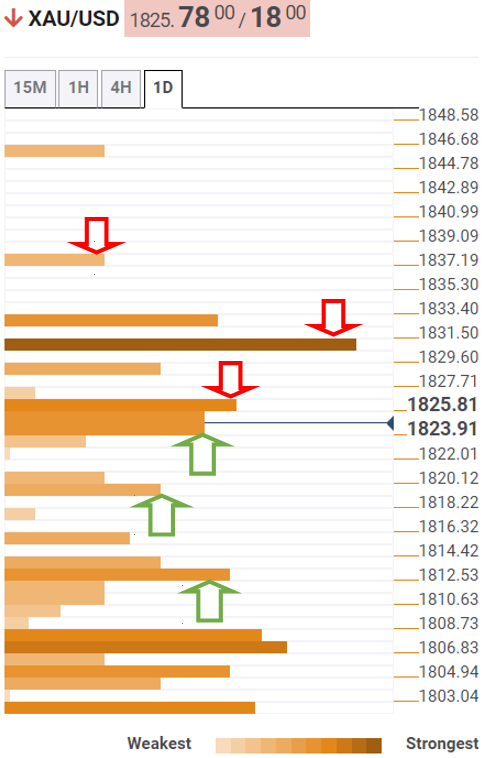
The Technical Confluences Detector shows that the gold price needs to crack strong resistance at $1,826, the Fibonacci 23.6% one-day.
The next critical upside hurdle is pegged at the previous month high of $1,831, above which bulls will aim for the pivot point one-day R2 at $1,837.
A firm break above the latter will open gates for a rally towards the pivot point one-day R3 at $1,845.
On the flip side, the Fibonacci 38.2% one-day at $1,821 is seen capping immediate pullbacks.
The confluence of the SMA10 four-hour, pivot point one-day S1 and Fibonacci 61.8% one-day at $1,819 will be on the sellers’ minds.
Further down, the previous day’s low of $1,815 could be retested, opening floors for a test of $1,812, where the Fibonacci 23.6% one-month and Fibonacci 61.8% one-week coincide.
Here is how it looks on the tool
About Technical Confluences Detector
The TCD (Technical Confluences Detector) is a tool to locate and point out those price levels where there is a congestion of indicators, moving averages, Fibonacci levels, Pivot Points, etc. If you are a short-term trader, you will find entry points for counter-trend strategies and hunt a few points at a time. If you are a medium-to-long-term trader, this tool will allow you to know in advance the price levels where a medium-to-long-term trend may stop and rest, where to unwind positions, or where to increase your position size.


© 2000-2026. All rights reserved.
This site is managed by Teletrade D.J. LLC 2351 LLC 2022 (Euro House, Richmond Hill Road, Kingstown, VC0100, St. Vincent and the Grenadines).
The information on this website is for informational purposes only and does not constitute any investment advice.
The company does not serve or provide services to customers who are residents of the US, Canada, Iran, The Democratic People's Republic of Korea, Yemen and FATF blacklisted countries.
Making transactions on financial markets with marginal financial instruments opens up wide possibilities and allows investors who are willing to take risks to earn high profits, carrying a potentially high risk of losses at the same time. Therefore you should responsibly approach the issue of choosing the appropriate investment strategy, taking the available resources into account, before starting trading.
Use of the information: full or partial use of materials from this website must always be referenced to TeleTrade as the source of information. Use of the materials on the Internet must be accompanied by a hyperlink to teletrade.org. Automatic import of materials and information from this website is prohibited.
Please contact our PR department if you have any questions or need assistance at pr@teletrade.global.
transfers