- Analytics
- News and Tools
- Market News
- Gold Price Forecast: XAU/USD key levels to watch, Fed in focus – Confluence Detector
Gold Price Forecast: XAU/USD key levels to watch, Fed in focus – Confluence Detector
- Gold price remains stuck between the Russia-Ukraine crisis and the Fed.
- Traders turn cautious as Fed is likely to hint at a March rate hike.
- Gold Price Forecast: XAU/USD risks correction on death cross, potential Fed’s hawkishness
Gold price has paused its two-day uptrend, as bulls contemplate the next move, in anticipation of the critical Fed interest rate decision. Fed is seen hinting at a March rate lift-off while traders will closely eye any signals on the timing of the balance sheet reduction. Expectations of a hawkish Fed outcome are limiting the upside in gold price, although bulls draw support from the ongoing Russia-Ukraine geopolitical turmoil. Let’s take a look at gold’s key technical levels in the run-up to the Fed showdown.
Read: Fed January Preview: Three possible scenarios for gold
Gold Price: Key levels to watch
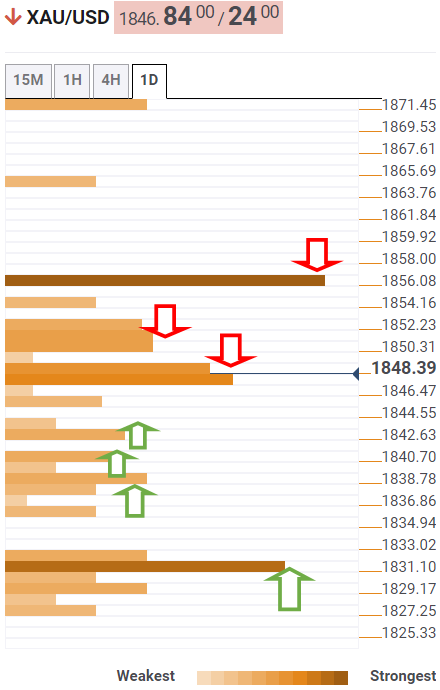
The Technical Confluences Detector shows that the gold price is consolidating below a bunch of healthy resistance levels stacked up around $1,849.
At that supply zone, the previous week’s high coincides with Fibonacci 38.2% one-day.
The immediate upside meets strong offers around $1,852, the confluence of the pivot point one-week R1, Fibonacci 23.6% one-day and Bollinger Band one-day Upper.
The intersection of the pivot point one-day R1 and pivot point one-month R1 at $1,856 is the level to beat for gold bulls.
On the other hand, if the correction picks up steam, then the immediate support awaits at the Fibonacci 61.8% one-day at $1,842.
The next significant cushion is placed at $1,840, the SMA5 one-day, below which the Fibonacci 23.6% one-week at $1,837 will get tested.
A sharp sell-off will be triggered below the last, calling for a test of the previous month’s high of $1,831.
Here is how it looks on the tool
About Technical Confluences Detector
The TCD (Technical Confluences Detector) is a tool to locate and point out those price levels where there is a congestion of indicators, moving averages, Fibonacci levels, Pivot Points, etc. If you are a short-term trader, you will find entry points for counter-trend strategies and hunt a few points at a time. If you are a medium-to-long-term trader, this tool will allow you to know in advance the price levels where a medium-to-long-term trend may stop and rest, where to unwind positions, or where to increase your position size.


© 2000-2026. All rights reserved.
This site is managed by Teletrade D.J. LLC 2351 LLC 2022 (Euro House, Richmond Hill Road, Kingstown, VC0100, St. Vincent and the Grenadines).
The information on this website is for informational purposes only and does not constitute any investment advice.
The company does not serve or provide services to customers who are residents of the US, Canada, Iran, The Democratic People's Republic of Korea, Yemen and FATF blacklisted countries.
Making transactions on financial markets with marginal financial instruments opens up wide possibilities and allows investors who are willing to take risks to earn high profits, carrying a potentially high risk of losses at the same time. Therefore you should responsibly approach the issue of choosing the appropriate investment strategy, taking the available resources into account, before starting trading.
Use of the information: full or partial use of materials from this website must always be referenced to TeleTrade as the source of information. Use of the materials on the Internet must be accompanied by a hyperlink to teletrade.org. Automatic import of materials and information from this website is prohibited.
Please contact our PR department if you have any questions or need assistance at pr@teletrade.global.
transfers