- Analytics
- News and Tools
- Market News
- Gold Price Forecast: XAU/USD relief rally needs acceptance above key $1,836 level – Confluence Detector
Gold Price Forecast: XAU/USD relief rally needs acceptance above key $1,836 level – Confluence Detector
- Gold Price rebounds from three-month lows, as risk sentiment recovers.
- End of the week flows could add legs to the relief rally in XAU/USD.
- Recapturing the $1,836 level is critical for gold bulls after Thursday’s turmoil.
Gold Price is making a recovery attempt after the latest leg down to a new three-month low near $1,800. The market’s perception of risk sentiment and its impact on the US dollar valuations continue to play a key role, as global growth and inflation fears keep lurking. Hotter US inflation and expectations of aggressive Fed’s tightening renewed global economic slowdown concerns, as investors sought refuge in the ultimate safe-haven US dollar. Looking ahead, the end of the week flows and the dollar dynamics will continue to play a pivotal role in Gold Price action, as the turbulent week draws to an end.
Also read: Silver tests a make-or-break point
Gold Price: Key levels to watch
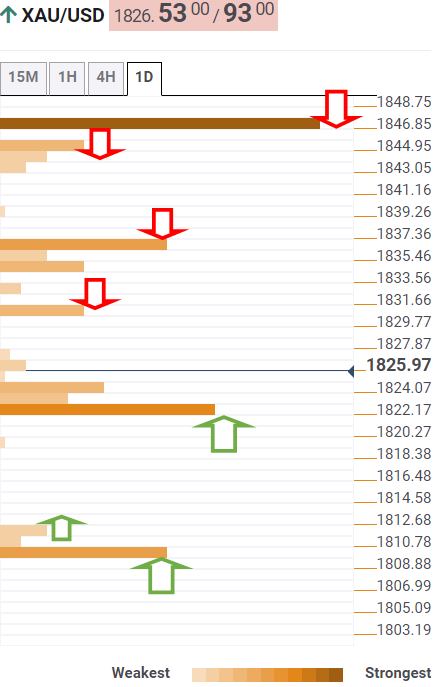
The Technical Confluences Detector shows that the Gold Price is eyeing a test of the Fibonacci 23.6% one-day at $1,830 on its road to recovery.
Recapturing that level will put minor resistance at $1,834 in XAU buyers’ sights.
Gold bulls need to find a strong foothold above the confluence of the Fibonacci 38.2% one-day and SMA200 one-day at $1,836 to affirm a meaningful recovery.
The next stop for bullish traders is seen at the Fibonacci 61.8% one-day at $1,843, above which the $1,847 hurdle will be challenged. At that point, the pivot point one-month S1 and pivot point one-day R1 meet.
On the downside, strong support is seen around $1,823, which is the convergence of the previous day’s low and the pivot point one-week S2.
A breach of the last will trigger a fresh downswing towards the intraday low of $1,810, below which the $1,808 cap will be the last line of defense for gold bulls. The latter is the pivot point one-day S1.
Here is how it looks on the tool
About Technical Confluences Detector
The TCD (Technical Confluences Detector) is a tool to locate and point out those price levels where there is a congestion of indicators, moving averages, Fibonacci levels, Pivot Points, etc. If you are a short-term trader, you will find entry points for counter-trend strategies and hunt a few points at a time. If you are a medium-to-long-term trader, this tool will allow you to know in advance the price levels where a medium-to-long-term trend may stop and rest, where to unwind positions, or where to increase your position size.


© 2000-2026. All rights reserved.
This site is managed by Teletrade D.J. LLC 2351 LLC 2022 (Euro House, Richmond Hill Road, Kingstown, VC0100, St. Vincent and the Grenadines).
The information on this website is for informational purposes only and does not constitute any investment advice.
The company does not serve or provide services to customers who are residents of the US, Canada, Iran, The Democratic People's Republic of Korea, Yemen and FATF blacklisted countries.
Making transactions on financial markets with marginal financial instruments opens up wide possibilities and allows investors who are willing to take risks to earn high profits, carrying a potentially high risk of losses at the same time. Therefore you should responsibly approach the issue of choosing the appropriate investment strategy, taking the available resources into account, before starting trading.
Use of the information: full or partial use of materials from this website must always be referenced to TeleTrade as the source of information. Use of the materials on the Internet must be accompanied by a hyperlink to teletrade.org. Automatic import of materials and information from this website is prohibited.
Please contact our PR department if you have any questions or need assistance at pr@teletrade.global.
transfers