- Analytics
- News and Tools
- Market News
- USD/JPY Price Analysis: A lurking rising wedge could open the door towards 132.00
USD/JPY Price Analysis: A lurking rising wedge could open the door towards 132.00
- The USD/JPY extends its weekly gains to 0.74% on Tuesday.
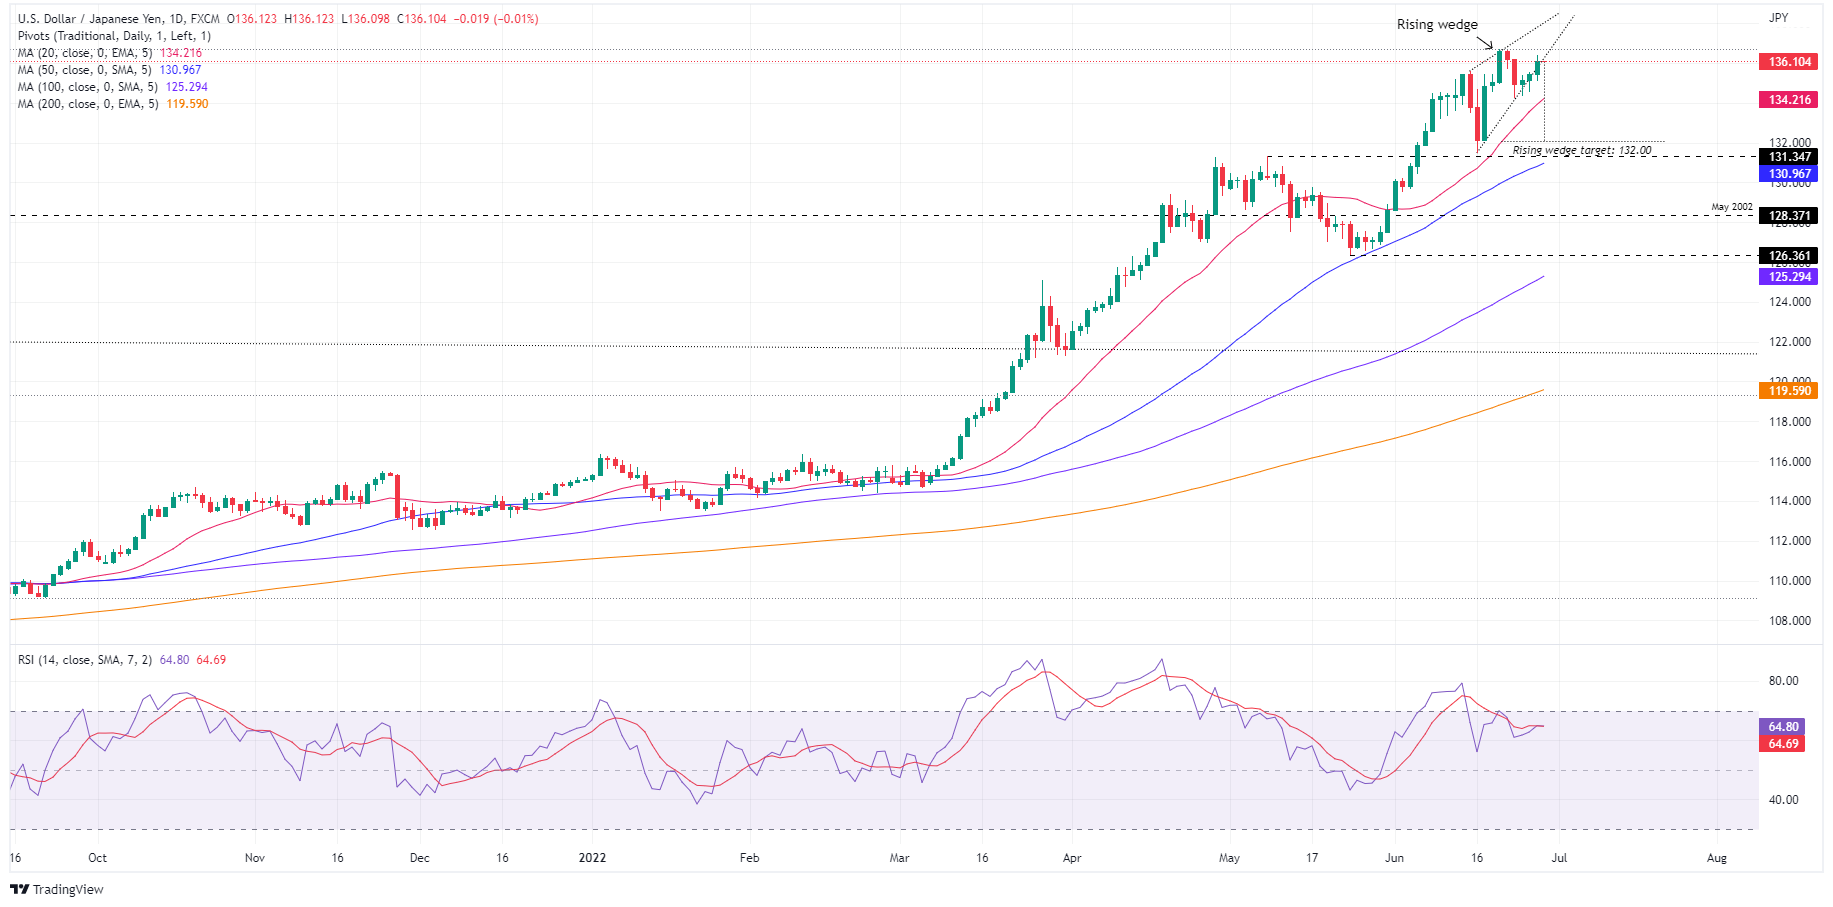
- Falling US Treasury yields capped any U¨SD/JPY’s attempts towards the YTD highs near 136.70s.
- A rising wedge in the USD/JPY daily chart looms; if it plays out, it will send the pair tumbling towards 132.00.
The USD/JPY extends its string of days, advancing to three straight, and registers a new weekly high near the 136.30s after bouncing from daily lows at around 135.10s earlier in the Asian session, gaining close to 80 pips in the day. At the time of writing, the USD/JPY is trading at 136.10.
Wall Street’s Tuesday session ended with substantial losses, between 1.56% and 3.09%. A risk-off mood impulse, usually a headwind for the major, backfired on the Japanese yen, which remains heavy on the Bank of Japan’s (BoJ) pledging for an ultra-loose monetary policy stance, despite dealing with a weaker JPY, which makes inflation less tolerable.
In the meantime, US Treasury yields receded from weekly highs. The US 10-year benchmark note rate edges down one basis point and sits at 3.183%, putting a lid on higher USD/JPY prices.
USD/JPY Daily chart
The USD/JPY is still upward biased, albeit closing to YTD highs and “verbal” intervention by Japanese authorities. However, price action begins to show the possible formation of a rising wedge, which would pave the way for a pullback. If that scenario plays out, the USD/JPY first target would be the 20-EMA at 133.92, followed by the June 16 swing low at 131.49. USD/JPY traders should be aware that once the latter’s cleared, the 50-EMA at around 130.80 would be in play.
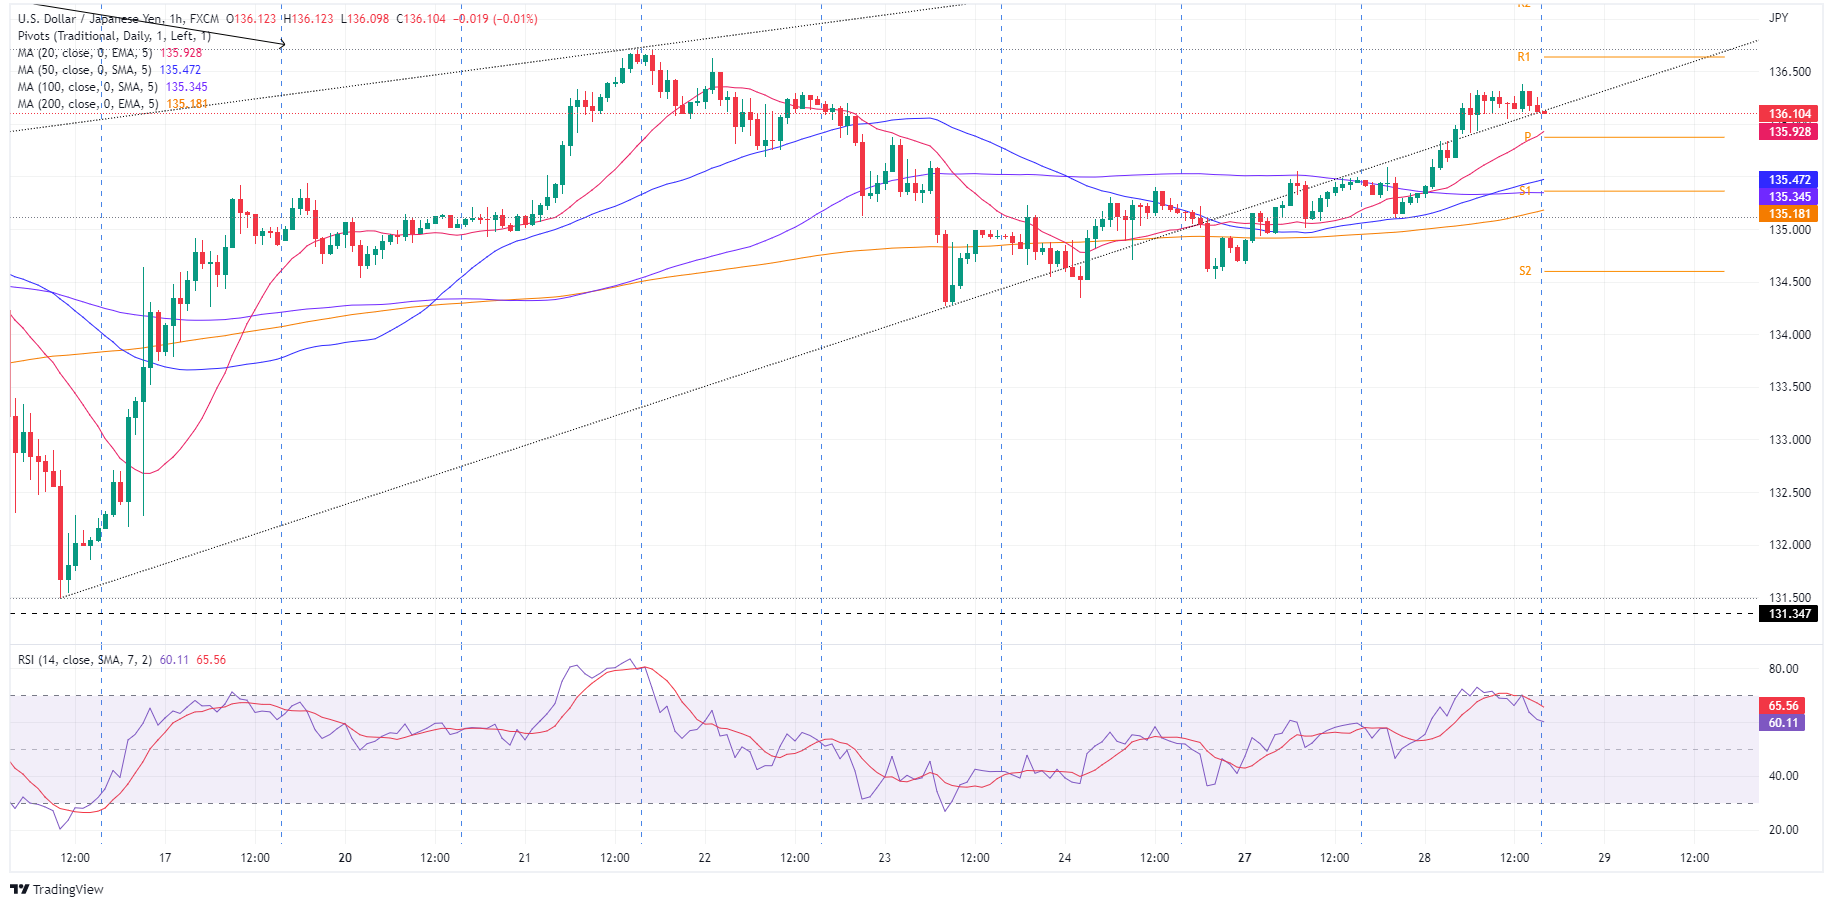
USD/JPY Hourly chart
The USD/JPY consolidates around the 135.00-136.20 area, clinging to Tuesday’s R2 daily pivot at 136.21. Traders should notice that the Relative Strength Index (RSI), albeit at 63.26, is aiming lower and trending below RSI’s 7-period SMA, a bearish signal suggesting downward pressure lying ahead.
USD/JPY buyers’ failure to break above 136.21 might open the door for further losses. That said, the major’s first support would be 136.00. Break below would expose the 20-EMA at 135.88, followed by the confluence of the 50 and 100-EMA around 135.45-34, respectively, and then the 200-EMA at 135.16.
Conversely, a USD/JPY’s upward break above 136.21 might open the door for a YTD test at 136.71.
USD/JPY Key Technical Levels


© 2000-2026. All rights reserved.
This site is managed by Teletrade D.J. LLC 2351 LLC 2022 (Euro House, Richmond Hill Road, Kingstown, VC0100, St. Vincent and the Grenadines).
The information on this website is for informational purposes only and does not constitute any investment advice.
The company does not serve or provide services to customers who are residents of the US, Canada, Iran, The Democratic People's Republic of Korea, Yemen and FATF blacklisted countries.
Making transactions on financial markets with marginal financial instruments opens up wide possibilities and allows investors who are willing to take risks to earn high profits, carrying a potentially high risk of losses at the same time. Therefore you should responsibly approach the issue of choosing the appropriate investment strategy, taking the available resources into account, before starting trading.
Use of the information: full or partial use of materials from this website must always be referenced to TeleTrade as the source of information. Use of the materials on the Internet must be accompanied by a hyperlink to teletrade.org. Automatic import of materials and information from this website is prohibited.
Please contact our PR department if you have any questions or need assistance at pr@teletrade.global.
transfers