- Analytics
- News and Tools
- Market News
- EUR/JPY Price Analysis: Euro losses ground against the yen and drops below 146.50
EUR/JPY Price Analysis: Euro losses ground against the yen and drops below 146.50
- EUR/JPY edges slightly up as the Asian Pacific session begins.
- The Euro weakened due to an adverse market sentiment spurred by recession fears.
- Short term, the EUR/JPY could tumble towards 145.40 once it clears the 146.00 figure.
The EUR/JPY tumbled from weekly highs around 147.00, for fundamental reasons, like the Eurozone (EU) inflation report, with September’s CPI around 9.9% YoY, less than estimates but elevated. Also, expectations for further central bank tightening spurred concerns of a global recession as risk-perceived assets edged lower. Therefore, safe-haven peers, like the Japanese yen (JPY), appreciated against the Euro. At the time of writing, the EUR/JPY is trading at 146.44, almost flat, as the Asian session begins.
EUR/JPY Price Forecast
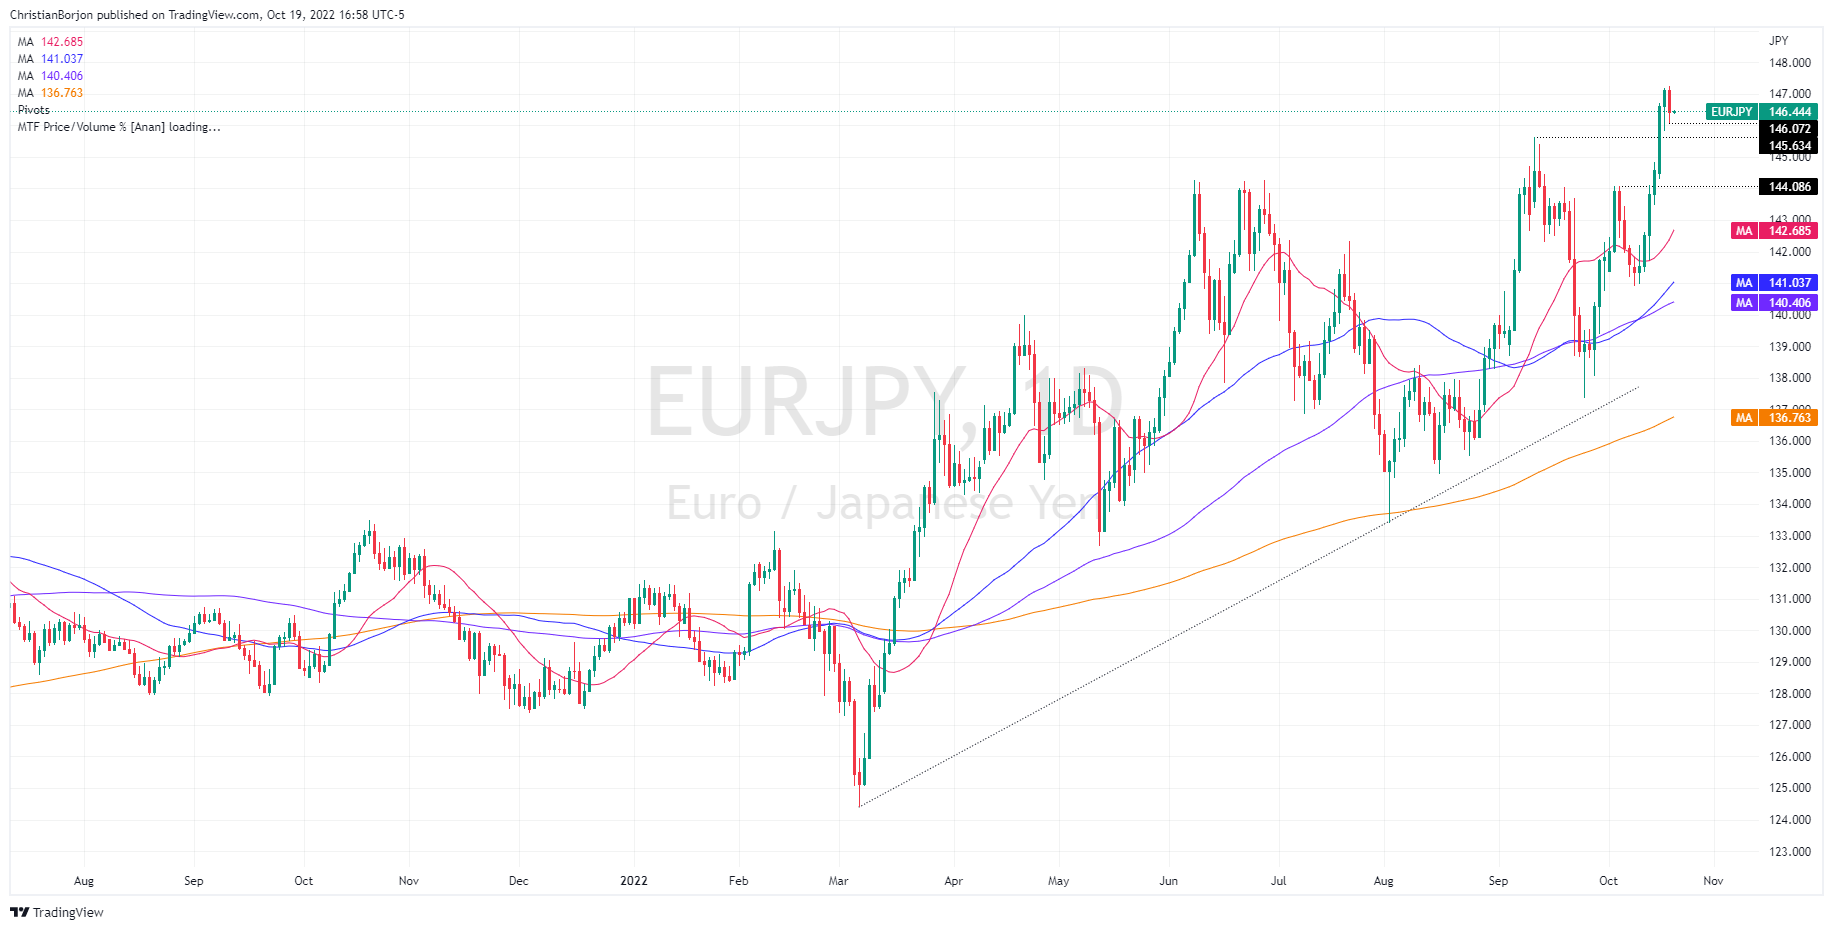
From a technical perspective, the EUR/JPY tested the YTD highs of 147.25 on Wednesday, though failure to hold the fort around the 147.00 figure exacerbated a drop towards the October 18 daily lows at 145.81. EUR/JPY traders should be aware that a bearish-harami candle chart pattern surfaced at the daily chart, warring downward action. Nevertheless, a break below October’s 18 daily low at 145.81 is needed to pave the way for further losses.
If that scenario plays out, the EUR/JPY first support would be the September 12 high-turned-support at 145.63. A breach of the latter will expose the 145.00 figure, followed by the October 5 swing high/support around 144.08.
EUR/JPY Daily Chart
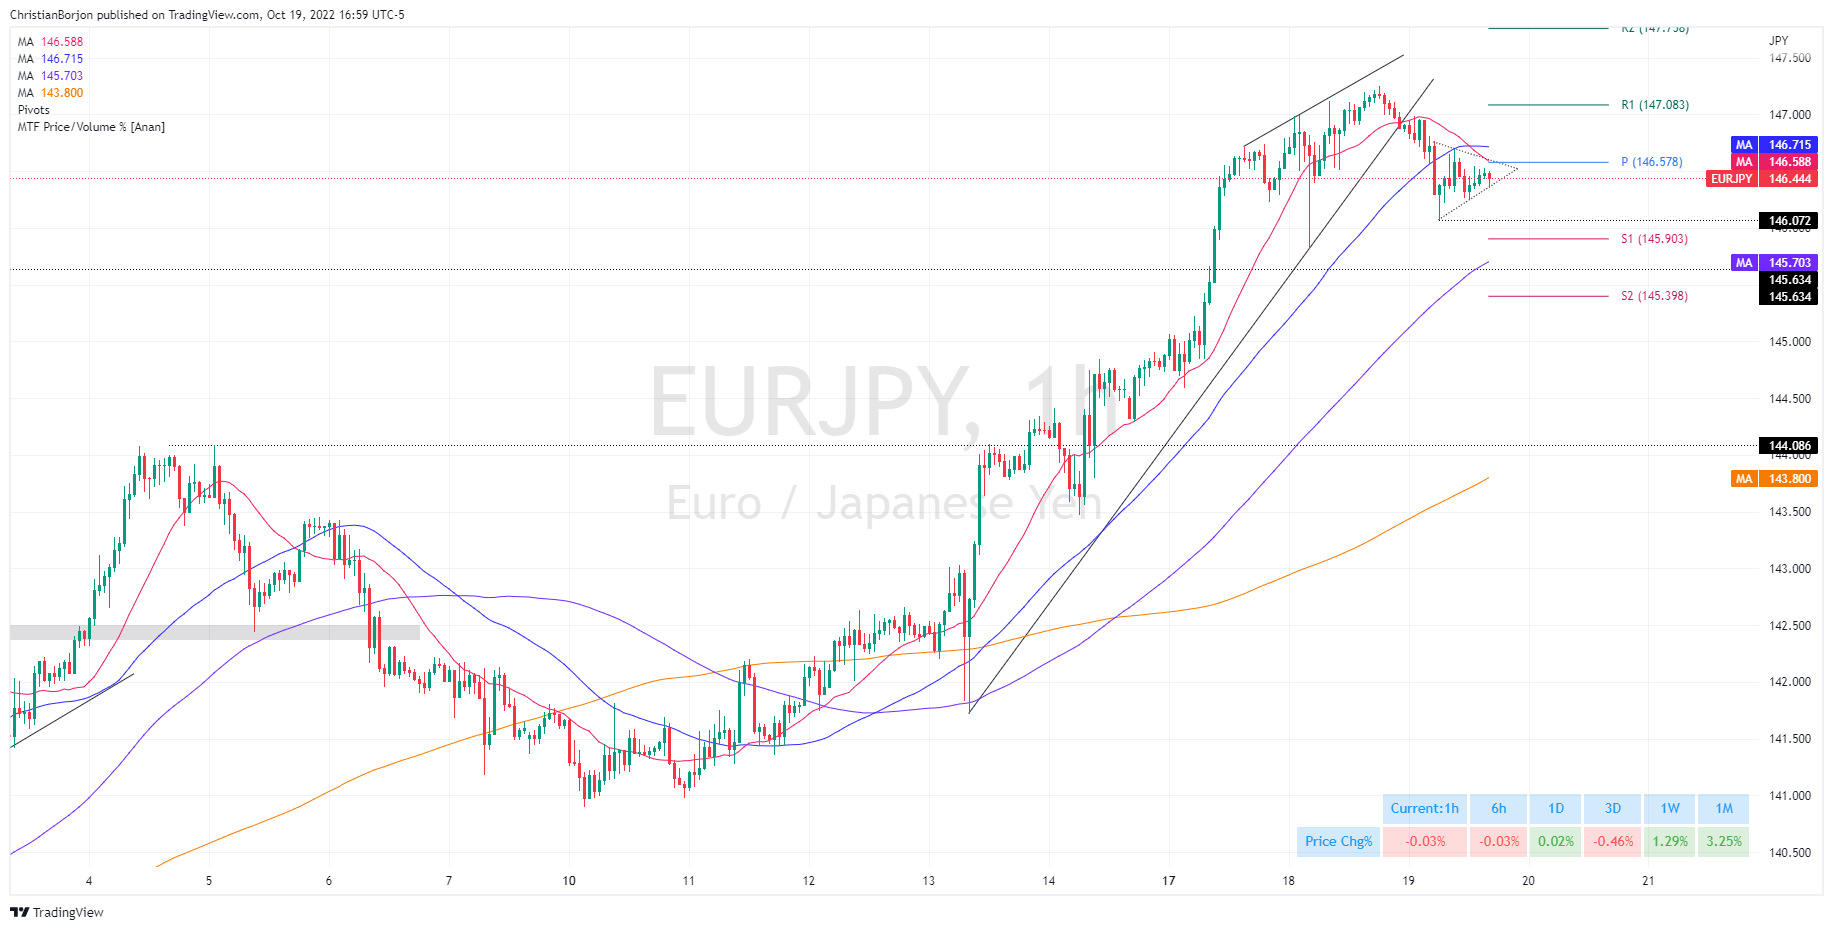
Near term, the EUR/JPY hourly chart illustrates the cross as neutral biased, with prices sliding below the 20 and 50-Exponential Moving Averages (EMAs), with the former crossing below the latter, opening the door for further losses. Notably, a symmetrical triangle on a downtrend surfaced, meaning that EUR/JPY risks are skewed to the downside.
Hence, the EUR/JPY first support would be October’s 19 daily low at 146.07. Break below will expose the S1 daily pivot point at 145.90, followed by the 100-EMA at 145.70, ahead of the S2 daily pivot level at 145.40.
EUR/JPY Hourly Chart


© 2000-2026. All rights reserved.
This site is managed by Teletrade D.J. LLC 2351 LLC 2022 (Euro House, Richmond Hill Road, Kingstown, VC0100, St. Vincent and the Grenadines).
The information on this website is for informational purposes only and does not constitute any investment advice.
The company does not serve or provide services to customers who are residents of the US, Canada, Iran, The Democratic People's Republic of Korea, Yemen and FATF blacklisted countries.
Making transactions on financial markets with marginal financial instruments opens up wide possibilities and allows investors who are willing to take risks to earn high profits, carrying a potentially high risk of losses at the same time. Therefore you should responsibly approach the issue of choosing the appropriate investment strategy, taking the available resources into account, before starting trading.
Use of the information: full or partial use of materials from this website must always be referenced to TeleTrade as the source of information. Use of the materials on the Internet must be accompanied by a hyperlink to teletrade.org. Automatic import of materials and information from this website is prohibited.
Please contact our PR department if you have any questions or need assistance at pr@teletrade.global.
transfers