- Analytics
- News and Tools
- Market News
- Gold Price Forecast: XAU/USD eyes $1,950 as US Dollar Index cracks, US Q4 GDP eyed
Gold Price Forecast: XAU/USD eyes $1,950 as US Dollar Index cracks, US Q4 GDP eyed
- Gold price is looking to test the $1,950.00 resistance amid volatility in the USD Index.
- A pause in BoC’s policy tightening conveys that major central banks are near to the terminal rate.
- More-than-projected contraction in the US Q4 GDP might accelerate recession fears.
Gold price (XAU/USD) is aiming to test the $1,950.00 resistance for the first time in the past nine months as the US Dollar Index has faced immense pressure. The precious metal displayed a vertical rally after dropping to near $1,920.00amid rising hopes that the Federal Reserve (Fed) has no other option than to announce a smaller interest rate hike ahead. Also, a pause announced in the policy tightening by the Bank of Canada (BoC) has conveyed a message that major central banks have reached to the terminal rate.
The US Dollar Index (DXY) has dropped to near seven-month low of around 101.20 and a downside break will trigger massive selling from the market participants. S&P managed to recover losses, portrayed optimism in the market and dips are being capitalized as a buying opportunity in the risk-perceived assets by the market participants. The 10-year US Treasury yields dropped to 3.44%.
For further guidance, investors will keep an eye on the release of the preliminary United States Gross Domestic Product (GDP) data for the fourth quarter of CY2022. As per the projections, the annualized GDP is seen lower at 2.6% vs. the prior release of 3.2%. An expression of a contraction in overall economic activities might accelerate recession fears on a broader basis.
Gold technical analysis
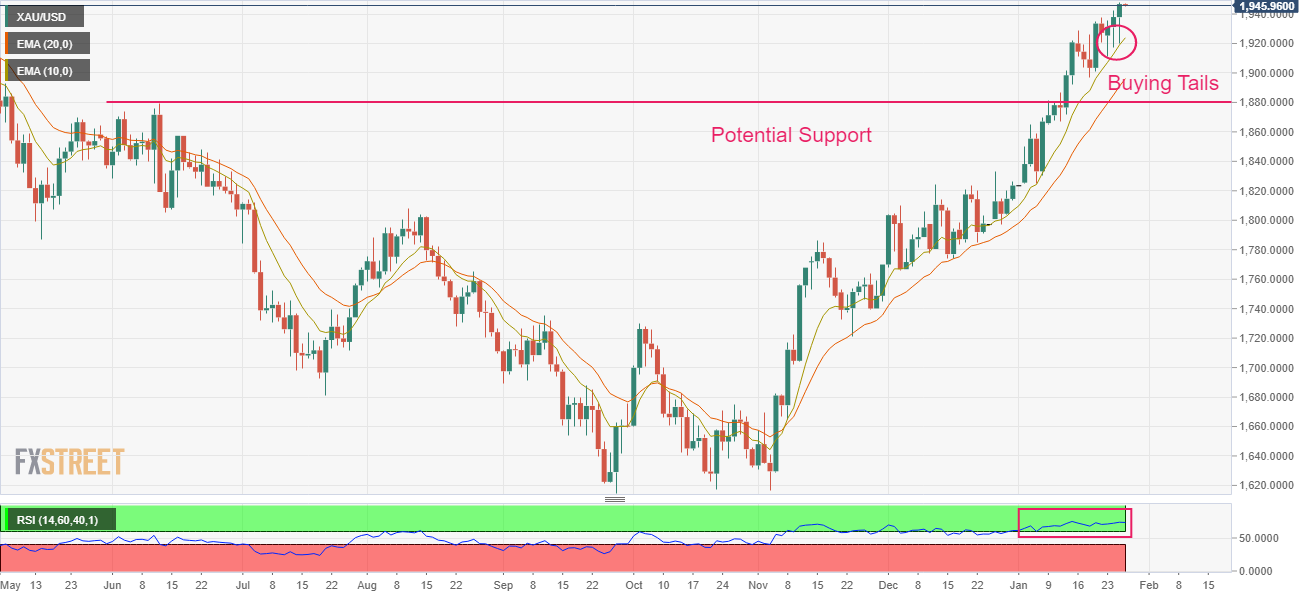
Gold price is in a strong uptrend forming higher highs and higher lows on a daily scale. The precious metal has witnessed three consecutive buying tails, which indicates that the market participants are buying the dips with immense interest. On a broader note, horizontal support plotted from June 13 high at $1,879.26 will be a cushion for the Gold price.
The 10-and 20-period Exponential Moving Averages (EMAs) at $1,924.74 and $1,895.26 respectively are aiming higher, which signals more upside ahead.
Also, the Relative Strength Index (RSI) (14) is oscillating in a bullish range of 60.00-80.00, which indicates that the bullish momentum is active.
Gold daily chart


© 2000-2026. All rights reserved.
This site is managed by Teletrade D.J. LLC 2351 LLC 2022 (Euro House, Richmond Hill Road, Kingstown, VC0100, St. Vincent and the Grenadines).
The information on this website is for informational purposes only and does not constitute any investment advice.
The company does not serve or provide services to customers who are residents of the US, Canada, Iran, The Democratic People's Republic of Korea, Yemen and FATF blacklisted countries.
Making transactions on financial markets with marginal financial instruments opens up wide possibilities and allows investors who are willing to take risks to earn high profits, carrying a potentially high risk of losses at the same time. Therefore you should responsibly approach the issue of choosing the appropriate investment strategy, taking the available resources into account, before starting trading.
Use of the information: full or partial use of materials from this website must always be referenced to TeleTrade as the source of information. Use of the materials on the Internet must be accompanied by a hyperlink to teletrade.org. Automatic import of materials and information from this website is prohibited.
Please contact our PR department if you have any questions or need assistance at pr@teletrade.global.
transfers