- Analytics
- News and Tools
- Market News
- Gold Price Forecast: XAU/USD refreshes day’s high above $1,930 ahead of Fed’s preferred inflation gauge
Gold Price Forecast: XAU/USD refreshes day’s high above $1,930 ahead of Fed’s preferred inflation gauge
- Gold price has refreshed its day high at $1,935.00 amid a volatile USD Index.
- The Fed is expected to hike interest rates by 25 bps to 4.50-4.75% next week.
- Gold bulls need immense strength to take out pessimism as the higher-low structure has messed up.
Gold price (XAU/USD) has refreshed its day’s high at $1,935.00 in the Asian session. The precious metal picked strength after a minor drop below $1,930.00, which poised a bargain opportunity for gold buyers. The US Dollar Index (DXY) slipped sharply after failing to surpass the critical hurdle of 101.80.
The USD Index dropped to near 101.40 and is likely to remain on tenterhooks ahead of the release of the Federal Reserve (Fed)’s most preferred inflation tool, the United States Personal Consumption Expenditure (PCE) Price Index (Dec). The economic data is seen rising by 0.3% vs. 0.2% reported earlier.
Meanwhile, the risk profile is displaying dubious outcomes as S&P500 futures are showing decent losses after an upbeat Thursday trading session. While the risk-perceived currencies are showing immense strength.
Gold price could face a squeeze in volatility as investors are broadly shifting their focus towards the announcement of the interest rate decision by Fed chair Jerome Powell next week. As per the CME FedWatch tool, the chances of a 50 basis point (bps) interest rate hike are less than even 1%. Therefore, the borrowing rates might escalate to 4.50-4.75%.
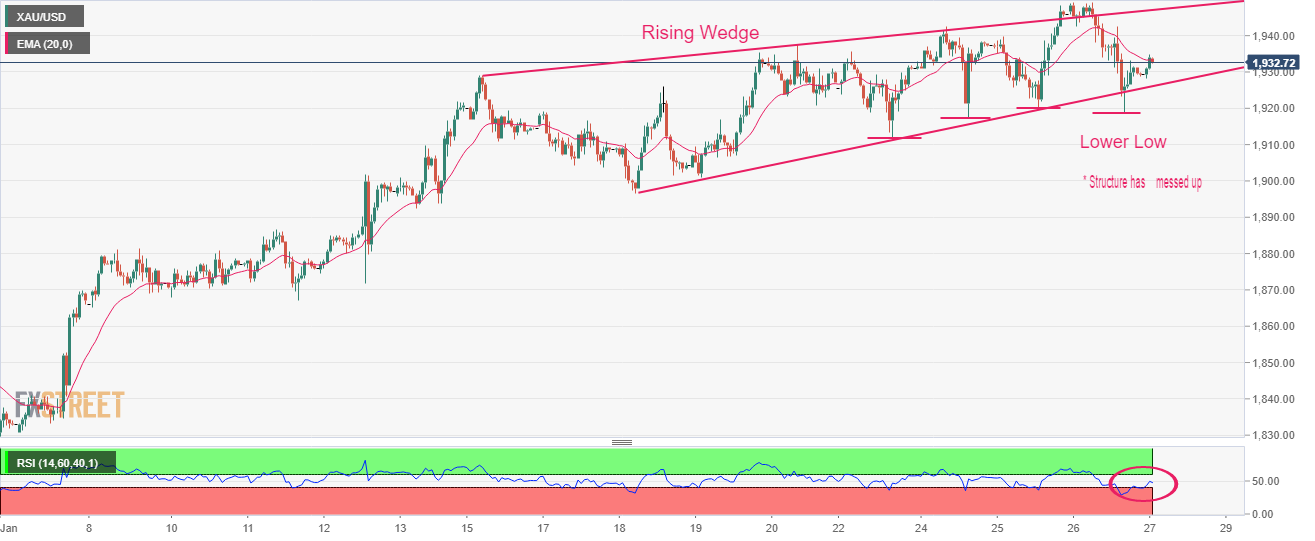
Gold technical analysis
Gold price is auctioning in a Rising Wedge chart pattern on an hourly scale, which indicates a volatility contraction on a broader note. The precious metals displayed a responsive buying action after dropping below January 25 low at $1,919.91, recorded a lower low, however the expression of the lower low is weak as buyers jumped in and demonstrated a firmer buying interest. But, one cannot deny the fact that the structure has messed up and the Gold bulls will require immense strength to remain in a positive trajectory.
The Gold price has recovered to near the 20-period Exponential Moving Average (EMA) at $1.933.16. Meanwhile, the Relative Strength Index (RSI) (14) is oscillating in a 40.00-60.00 range, which indicates a consolidation ahead.
Gold hourly chart


© 2000-2026. All rights reserved.
This site is managed by Teletrade D.J. LLC 2351 LLC 2022 (Euro House, Richmond Hill Road, Kingstown, VC0100, St. Vincent and the Grenadines).
The information on this website is for informational purposes only and does not constitute any investment advice.
The company does not serve or provide services to customers who are residents of the US, Canada, Iran, The Democratic People's Republic of Korea, Yemen and FATF blacklisted countries.
Making transactions on financial markets with marginal financial instruments opens up wide possibilities and allows investors who are willing to take risks to earn high profits, carrying a potentially high risk of losses at the same time. Therefore you should responsibly approach the issue of choosing the appropriate investment strategy, taking the available resources into account, before starting trading.
Use of the information: full or partial use of materials from this website must always be referenced to TeleTrade as the source of information. Use of the materials on the Internet must be accompanied by a hyperlink to teletrade.org. Automatic import of materials and information from this website is prohibited.
Please contact our PR department if you have any questions or need assistance at pr@teletrade.global.
transfers