- Analytics
- News and Tools
- Market News
- Gold Price Forecast: XAU/USD scales above $1,910 as SVB fallout limits Fed’s tightening pace
Gold Price Forecast: XAU/USD scales above $1,910 as SVB fallout limits Fed’s tightening pace
- Gold price has delivered a three-day winning streak on hopes of a slowdown in the Fed’s policy tightening pace.
- Going forward, a sheer volatility is expected ahead of the US inflation data.
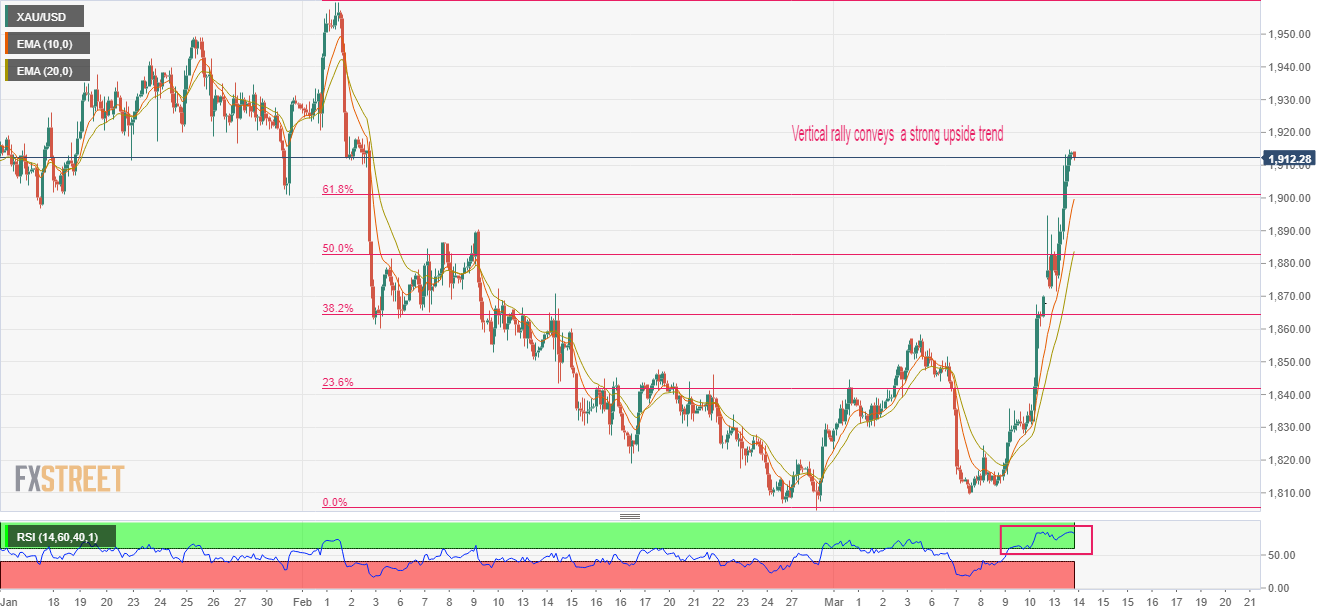
- A decisive break above 61.8% Fibo indicates that the asset will recapture the previous swing high ahead.
Gold price (XAU/USD) has refreshed its five-week high at $1,914.70 in the early Asian session. The precious metal has delivered a three-day winning streak and is expected to continue its upside momentum as a sudden collapse of Silicon Valley Bank (SVB) might force the Federal Reserve (Fed) to continue a lower pace of policy tightening if not halt the restrictive regime.
President Joe Biden said the administration's swift actions to ensure depositors can access their funds in Silicon Valley Bank (SVB) and Signature Bank (SBNY) should give Americans confidence that the U.S. banking system was safe, as reported by Reuters.
The US Dollar Index (DXY) has sensed an intermediate cushion around 103.50, however, sheer volatility is expected ahead as investors will keep an eye on the United States Consumer Price Index (CPI) data.
Analysts at Credit Suisse expect “Expect core CPI inflation to remain steady at 0.4% MoM in February, causing the YoY reading to tick down to 5.5%. Energy and food prices are likely to moderate, with headline inflation also coming in at 0.4% MoM. A reading in-line with our expectations would be uncomfortably high for the Fed, but still consistent with gradual disinflation this year.”
S&P500 futures are showing marginal gains after a subdued Monday, a case of a dead cat bounce, however, the risk sentiment is still negative. The 10-year US Treasury yields dropped to 3.54% as Fed chair Jerome Powell won’t go heavy on interest rates to maintain consumer confidence in the economy.
Gold technical analysis
Gold price has scaled above the 61.8% Fibonacci retracement (placed from February 2 high at $1,959.71 to February 28 low at $1,804.76) at $1.901.24. A decisive break above 61.8% Fibo indicates that the asset will recapture the previous swing high ahead.
Upward-sloping 20-and 50-period Exponential Moving Averages (EMAs) at $1,900 and $1,883.00 add to the upside filters.
The Relative Strength Index (RSI) (14) oscillates in the bullish range of 60.00-80.00, which indicates an upside momentum is already active. However, some corrections due to an overbought situation cannot be ruled out.
Gold two-hour chart


© 2000-2026. All rights reserved.
This site is managed by Teletrade D.J. LLC 2351 LLC 2022 (Euro House, Richmond Hill Road, Kingstown, VC0100, St. Vincent and the Grenadines).
The information on this website is for informational purposes only and does not constitute any investment advice.
The company does not serve or provide services to customers who are residents of the US, Canada, Iran, The Democratic People's Republic of Korea, Yemen and FATF blacklisted countries.
Making transactions on financial markets with marginal financial instruments opens up wide possibilities and allows investors who are willing to take risks to earn high profits, carrying a potentially high risk of losses at the same time. Therefore you should responsibly approach the issue of choosing the appropriate investment strategy, taking the available resources into account, before starting trading.
Use of the information: full or partial use of materials from this website must always be referenced to TeleTrade as the source of information. Use of the materials on the Internet must be accompanied by a hyperlink to teletrade.org. Automatic import of materials and information from this website is prohibited.
Please contact our PR department if you have any questions or need assistance at pr@teletrade.global.
transfers