- Analytics
- News and Tools
- Market News
- NZD/USD Price Analysis: Formation of an Inverted H&S favors a solid upside
NZD/USD Price Analysis: Formation of an Inverted H&S favors a solid upside
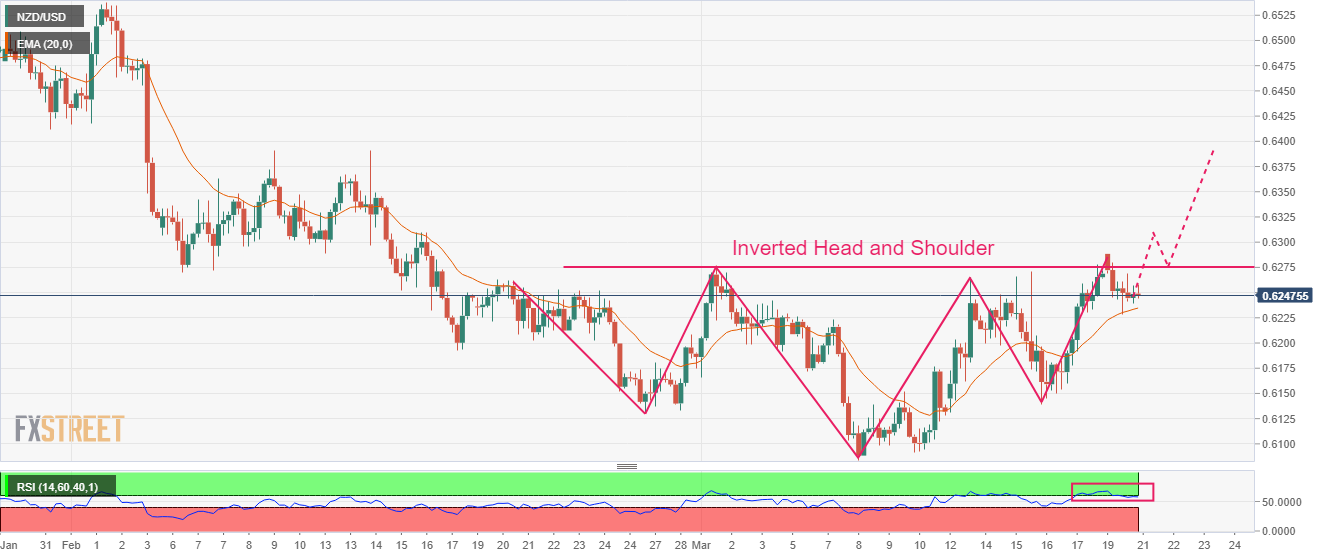
- NZD/USD has remained sideways after failing to recapture the immediate resistance of 0.6280.
- The formation of an Inverted H&S formation solidifies a bullish reversal ahead.
- The 20-period EMA at 0.6234 is providing a cushion to the New Zealand Dollar.
The NZD/USD pair is making efforts in defending the critical support of 0.6240 in the early Asian session. The Kiwi asset has remained sideways from Monday after failing to recapture the immediate resistance of 0.6280. Mixed responses to the interest rate policy of the Federal Reserve (Fed) have shifted the major to the sideline.
S&P500 futures have continued their upside momentum after a decent recovery on Monday, portraying appreciation in the risk-taking ability of the market participants. The US Dollar Index (DXY) continued its losing spell on Monday led by United States banking shakedown.
The New Zealand Dollar didn’t display any significant action on steady monetary policy by the People’s Bank of China (PBoC). The street was anticipating further rate cuts to spurt the overall demand in the Chinese economy. It is worth noting that New Zealand is one of the crucial trading partners of China and further expansion in PBoC’s monetary policy would have supported the New Zealand Dollar.
NZD/USD is forming an Inverted Head and Shoulder chart pattern on a four-hour scale. The chart pattern displays a prolonged consolidation and results in a bullish reversal after a breakout of the neckline, which is plotted from the March 01 high at 0.6276.
The 20-period Exponential Moving Average (EMA) at 0.6234 is providing a cushion to the New Zealand Dollar.
Meanwhile, the Relative Strength Index (RSI) (14) is making efforts in reclaiming the bullish range of 60.00-80.00. An occurrence of the same would solidify the Kiwi asset further.
A buying opportunity in the Kiwi asset will emerge it will surpass March 1 high at 0.6276, which will drive the pair toward the round-level resistance at 0.6300 followed by February 14 high at 0.6389.
In an alternate scenario, a breakdown of the January 6 low at 0.6193 will drag the asset toward November 28 low at 0.6155. A slippage below the latter will expose the asset for more downside toward the round-level support at 0.6100.
NZD/USD four-hour chart


© 2000-2026. All rights reserved.
This site is managed by Teletrade D.J. LLC 2351 LLC 2022 (Euro House, Richmond Hill Road, Kingstown, VC0100, St. Vincent and the Grenadines).
The information on this website is for informational purposes only and does not constitute any investment advice.
The company does not serve or provide services to customers who are residents of the US, Canada, Iran, The Democratic People's Republic of Korea, Yemen and FATF blacklisted countries.
Making transactions on financial markets with marginal financial instruments opens up wide possibilities and allows investors who are willing to take risks to earn high profits, carrying a potentially high risk of losses at the same time. Therefore you should responsibly approach the issue of choosing the appropriate investment strategy, taking the available resources into account, before starting trading.
Use of the information: full or partial use of materials from this website must always be referenced to TeleTrade as the source of information. Use of the materials on the Internet must be accompanied by a hyperlink to teletrade.org. Automatic import of materials and information from this website is prohibited.
Please contact our PR department if you have any questions or need assistance at pr@teletrade.global.
transfers