- Analytics
- News and Tools
- Market News
- Gold Price Forecast: XAU/USD approaches $1,980 as USD Index extends losses on Fed’s dovish guidance
Gold Price Forecast: XAU/USD approaches $1,980 as USD Index extends losses on Fed’s dovish guidance
- Gold price is marching toward $1,980.00 as fears of a US banking crisis renewed.
- The USD Index has been battered as Fed has come extremely close to the terminal rate.
- US bonds have been resilient as the US government is not considering insuring all uninsured bank deposits.
Gold price (XAU/USD) is gathering strength to capture the immediate resistance of $1,980.00 in the Asian session. The precious metal has found demand as the US Dollar Index (DXY) has resumed its downside journey and fears of a US banking crisis have refreshed.
The USD Index is looking to refresh its six-month low below 102.00 as the Federal Reserve (Fed) has come extremely close to the terminal rate, which would be restrictive enough to bring down the United States inflation to 2%. Fed chair Jerome Powell in his commentary stated, “some additional policy firming may be appropriate”.
Investors should be aware of the fact that the US banking fiasco had underpinned Gold as a safe-haven to dodge volatility. However, an assurance of safety for all banking deposits from US Treasury Secretary Janet Yellen had receded fears of the banking crisis.
The situation seems changed now as US Yellen commented on Wednesday that the government "is not considering insuring all uninsured bank deposits." This has also strengthened the demand for US government bonds. The 10-year US Treasury yields have dropped further to near 3.45%.
Meanwhile, S&P500 futures have recovered firmly after a dive move on Wednesday, portraying an improvement in the risk appetite, however, caution still prevails as tight credit conditions from US banks will have a long-term impact. As per Fed’s commentary, US banking is sound and resilient but US banks will be more precautionary while disbursing advances to households and businesses.
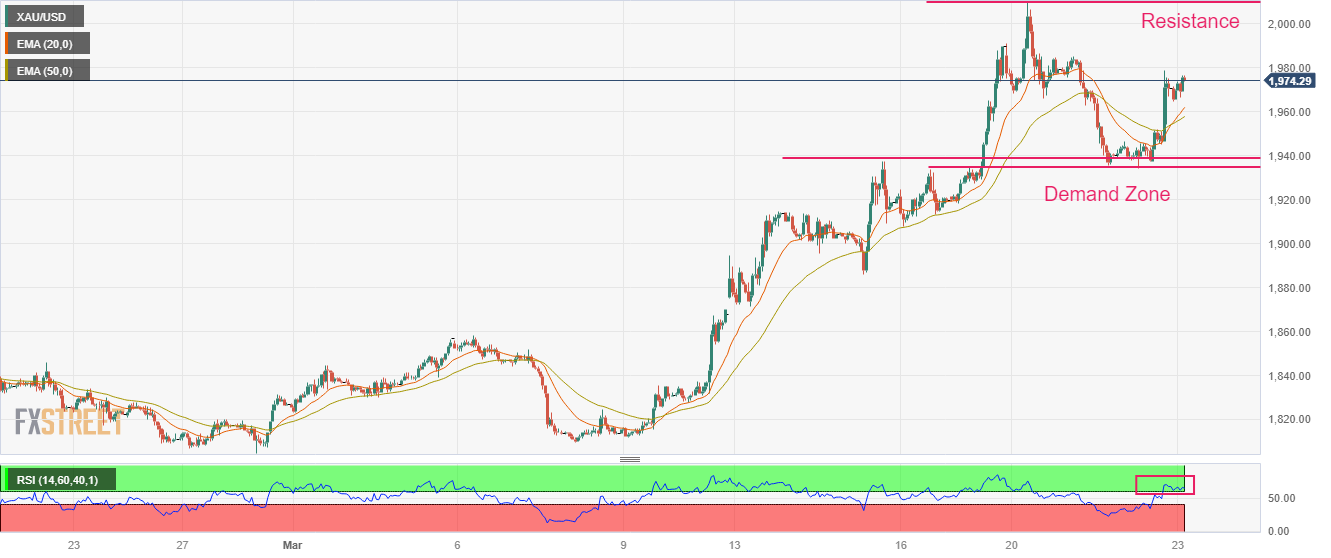
Gold technical analysis
Gold price has shown a stellar recovery after sensing significant buying interest around the demand zone placed in a range of $1,933.90-1,938.40 on an hourly scale. The asset is marching towards the critical resistance plotted from March 20 high at $2,009.88.
A bull cross, represented by the 20-and 50-period Exponential Moving Averages (EMAs) at $1,954.39, adds to the upside filters.
The Relative Strength Index (RSI) (14) is oscillating in the bullish range of 60.00-80.00, which indicates more upside ahead.
Gold hourly chart


© 2000-2026. All rights reserved.
This site is managed by Teletrade D.J. LLC 2351 LLC 2022 (Euro House, Richmond Hill Road, Kingstown, VC0100, St. Vincent and the Grenadines).
The information on this website is for informational purposes only and does not constitute any investment advice.
The company does not serve or provide services to customers who are residents of the US, Canada, Iran, The Democratic People's Republic of Korea, Yemen and FATF blacklisted countries.
Making transactions on financial markets with marginal financial instruments opens up wide possibilities and allows investors who are willing to take risks to earn high profits, carrying a potentially high risk of losses at the same time. Therefore you should responsibly approach the issue of choosing the appropriate investment strategy, taking the available resources into account, before starting trading.
Use of the information: full or partial use of materials from this website must always be referenced to TeleTrade as the source of information. Use of the materials on the Internet must be accompanied by a hyperlink to teletrade.org. Automatic import of materials and information from this website is prohibited.
Please contact our PR department if you have any questions or need assistance at pr@teletrade.global.
transfers