- Analytics
- News and Tools
- Market News
- Silver Price Analysis: XAG/USD seems vulnerable, bears await break below 38.2% Fibo.
Silver Price Analysis: XAG/USD seems vulnerable, bears await break below 38.2% Fibo.
- Silver drops to a multi-week low, though finds some support near the 38.2% Fibo. level.
- The technical setup favours bearish traders and supports prospects for deeper losses.
- A sustained strength beyond the $24.20-30 area is needed to negate the negative bias.
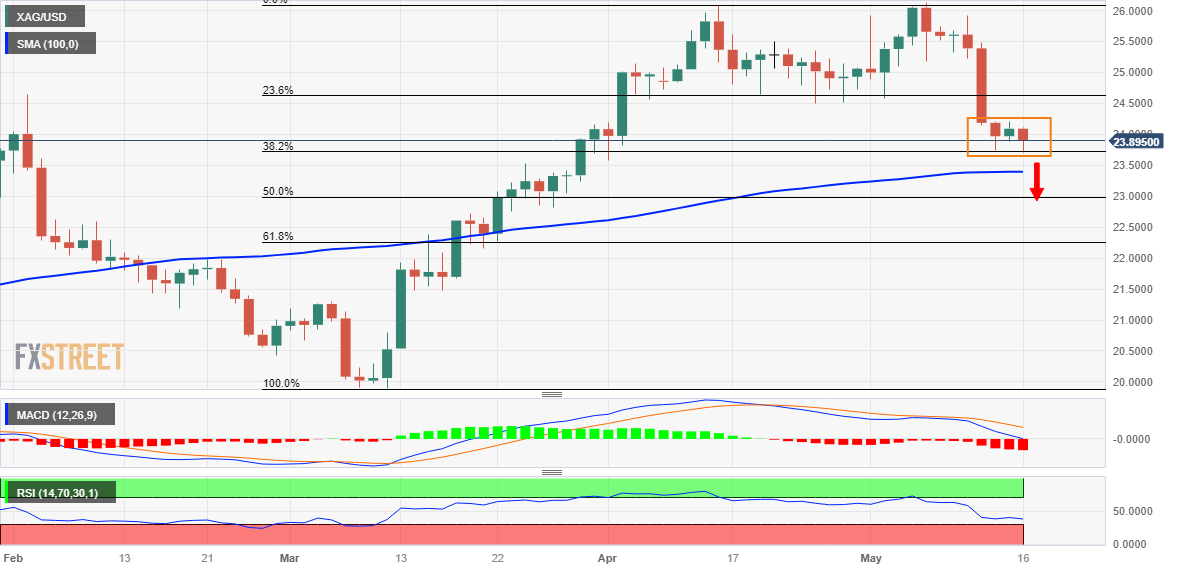
Silver comes under some renewed selling pressure following the previous day's modest uptick and drops to its lowest level since April 3 during the first half of trading on Tuesday. The white metal, however, finds some support near the 38.2% Fibonacci retracement level of the March-May rise and trades just below the $24.00 mark during the early European session, still down 0.80% for the day.
From a technical perspective, the two-way price move witnessed over the past three days constitutes the formation of a rectangle on hourly charts. Against the backdrop of the recent sharp pullback from over a one-year top, this might still be categorized as a bearish consolidation phase. Moreover, oscillators on hourly/daily charts are holding deep in the negative territory and support prospects for further losses.
That said, it will still be prudent to wait for a sustained break below the $23.70-$23.65 area (38.2% Fibo.) before positioning for an extension of over a one-week-old downtrend. The XAG/USD might then test the $23.40 strong horizontal support, which coincides with the 100-day Simple Moving Average (SMA). The latter should act as a pivotal point to determine the near-term trajectory.
The subsequent downfall could drag the XAG/USD towards 50% Fibo. level, around the $23.00 round-figure mark. The next relevant support is pegged near the $22.65-$22.60 region ahead of the $22.30-$22.25 zone, or the 61.8% Fibo. level. A convincing break below the latter will be seen as a fresh trigger for bearish traders and pave the way for a further depreciating move.
On the flip side, the top end of a short-term trading range, around the $24.15-$24.20 region, could act as an immediate hurdle. A sustained strength beyond might trigger a short-covering rally and lift the XAG/USD towards the 23.6% Fibo. level, around the $24.60 zone. Some follow-through buying should allow bulls to reclaim the $25.00 psychological mark and aim to test the next resistance near the $25.30-$25.40 supply zone.
Silver daily chart
Key levels to watch


© 2000-2026. All rights reserved.
This site is managed by Teletrade D.J. LLC 2351 LLC 2022 (Euro House, Richmond Hill Road, Kingstown, VC0100, St. Vincent and the Grenadines).
The information on this website is for informational purposes only and does not constitute any investment advice.
The company does not serve or provide services to customers who are residents of the US, Canada, Iran, The Democratic People's Republic of Korea, Yemen and FATF blacklisted countries.
Making transactions on financial markets with marginal financial instruments opens up wide possibilities and allows investors who are willing to take risks to earn high profits, carrying a potentially high risk of losses at the same time. Therefore you should responsibly approach the issue of choosing the appropriate investment strategy, taking the available resources into account, before starting trading.
Use of the information: full or partial use of materials from this website must always be referenced to TeleTrade as the source of information. Use of the materials on the Internet must be accompanied by a hyperlink to teletrade.org. Automatic import of materials and information from this website is prohibited.
Please contact our PR department if you have any questions or need assistance at pr@teletrade.global.
transfers