- Analytics
- News and Tools
- Market News
- Gold Price Forecast: XAU/USD rebounds above $1,990 but needs to pass more filters to regain confidence
Gold Price Forecast: XAU/USD rebounds above $1,990 but needs to pass more filters to regain confidence
- Gold price is retesting the breakdown of the Rising Channel pattern amid a delay in US debt-ceiling issues.
- A slower pace in the expansion of US Retail Sales has strengthened expectations of a steady monetary policy stance by the Fed.
- The postponement of approval for the debt-ceiling cap has improved demand for US government bonds.
Gold price (XAU/USD) has shown some buying interest after dropping below $1,990.00 in the Tokyo session. The precious metal has witnessed some recovery as the US Dollar Index (DXY) is struggling in extending its upside move further above 102.70. The Gold price has yet not developed a strong upside bias as it needs to pass through more filters for gaining traction.
S&P500 futures have added decent gains in Asia despite the postponement of approval for raising the US Treasury borrowing cap limit. One thing is for sure that the approval of default is off the table. Every delegate has admitted that the US debt-ceiling cannot be raised along with bulking spending initiatives as it could be a disaster.
The postponement of approval for the debt-ceiling cap has improved demand for US government bonds. This has led to a decline in 10-year US Treasury yields to 3.53%.
The USD Index is facing barricades in extending its recovery above 102.70 as a slower pace in the expansion of US Retail Sales has strengthened expectations of a steady monetary policy stance by the Federal Reserve (Fed). The economic data expanded at a slower pace of 0.4% against the estimate of 0.7%. A mild expansion is insufficient to impact expectations for a steady monetary policy by the Fed.
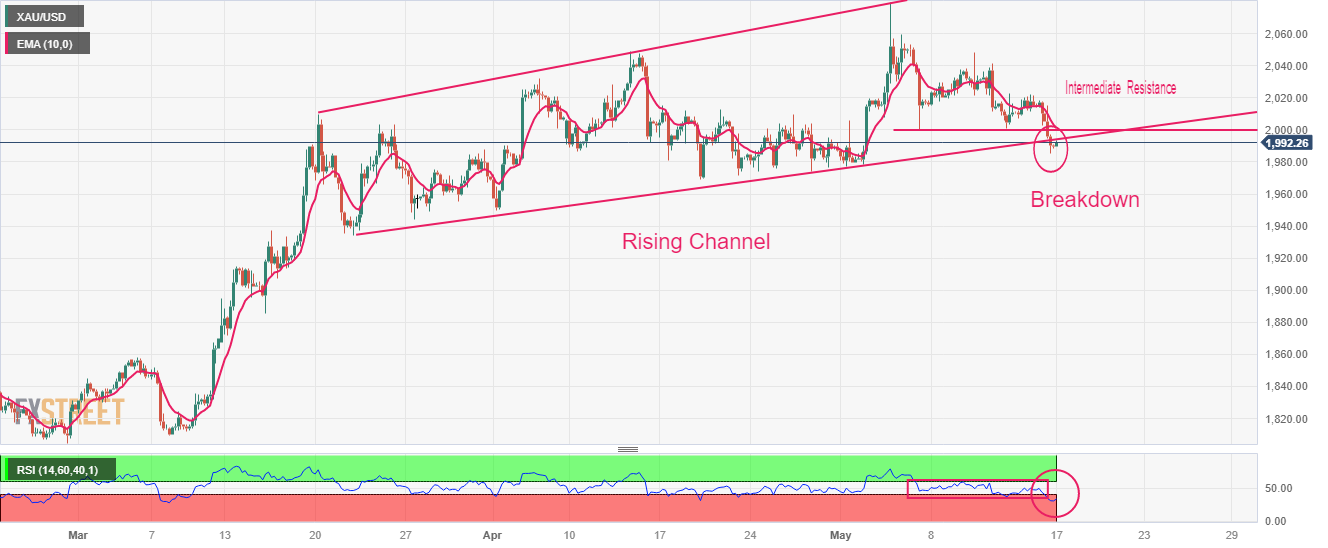
Gold technical analysis
Gold price has delivered a breakdown of the Rising Channel chart pattern formed on a four-hour scale, however, the breakdown needs to pass some more filters yet. An intermediate resistance is plotted from May 05 low at $1,999.54. Downward-sloping 10-period Exponential Moving Average (EMA) at $2,000.00 is barricading the Gold bulls.
The Relative Strength Index (RSI) (14) has slipped into the bearish range of 20.00-40.00, which indicates more downside ahead.
Gold four-hour chart


© 2000-2026. All rights reserved.
This site is managed by Teletrade D.J. LLC 2351 LLC 2022 (Euro House, Richmond Hill Road, Kingstown, VC0100, St. Vincent and the Grenadines).
The information on this website is for informational purposes only and does not constitute any investment advice.
The company does not serve or provide services to customers who are residents of the US, Canada, Iran, The Democratic People's Republic of Korea, Yemen and FATF blacklisted countries.
Making transactions on financial markets with marginal financial instruments opens up wide possibilities and allows investors who are willing to take risks to earn high profits, carrying a potentially high risk of losses at the same time. Therefore you should responsibly approach the issue of choosing the appropriate investment strategy, taking the available resources into account, before starting trading.
Use of the information: full or partial use of materials from this website must always be referenced to TeleTrade as the source of information. Use of the materials on the Internet must be accompanied by a hyperlink to teletrade.org. Automatic import of materials and information from this website is prohibited.
Please contact our PR department if you have any questions or need assistance at pr@teletrade.global.
transfers