- Analytics
- News and Tools
- Market News
- Gold Price Forecast: XAU/USD eyes more weakness below $1,970 amid optimism for US debt-ceiling raise
Gold Price Forecast: XAU/USD eyes more weakness below $1,970 amid optimism for US debt-ceiling raise
- Gold price has shown a perpendicular downfall after retreating from $1,985.00 amid a solid recovery in the USD index.
- Plenty of US economic indicators are strengthening the need of pausing interest rates by the Fed.
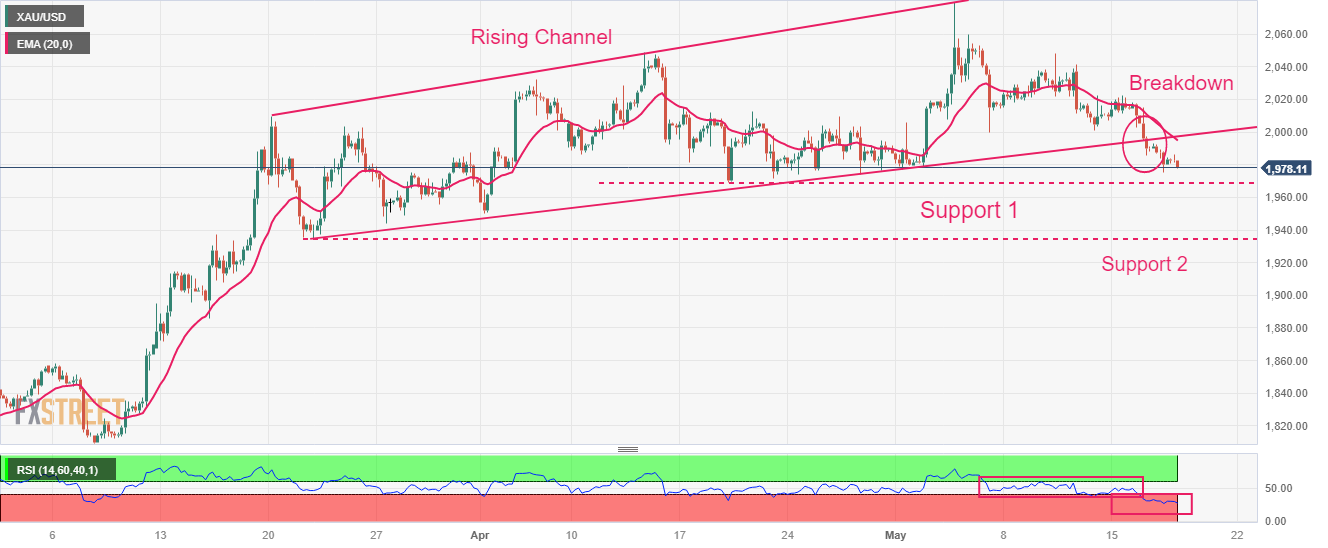
- Gold price has shown a vertical fall after delivering a breakdown of the Rising Channel pattern.
Gold price (XAU/USD) has witnessed immense selling pressure after retreating from $1,985.00 in the early European session. The precious metal is expected to deliver more weakness on a slippage below the immediate support of $1,970.00 as soaring optimism for the US debt-ceiling raise approval is weighing heavily on bullions.
S&P500 futures have also sensed selling pressure after some recovery, portraying a rebound in the risk-aversion theme. The US Dollar Index (DXY) is all set to recapture the critical resistance of 103.00 on expectations that the US debt-ceiling raise proposal would get approval by compromising President’s spending initiatives.
House of Representatives Speaker Joseph McCarthy has got ready to hike the US borrowing cap over the compromise of further budget deficit as the duo could be a disaster for the US economy.
The US Dollar Index is managing to defend its downside despite higher anticipation for a pause in the policy-tightening spell by the Federal Reserve (Fed). According to a poll by Reuters current interest rate at 5.00-5.25% will stay by the end of 2023.
Right from consistent decline in United States inflation, easing labor market conditions to contracting retail demand and deepening fears of economic recession, plenty of economic indicators are strengthening the need of pausing interest rates.
Gold technical analysis
Gold price has shown a perpendicular fall after delivering a breakdown of the Rising Channel chart pattern formed on a four-hour scale. Potential supports are placed from April 19 and March 21 low at $1,969.26 and $1,935.68 respectively. Downward-sloping 20-period Exponential Moving Average (EMA) at $1,994.56 is barricading the Gold bulls.
The Relative Strength Index (RSI) (14) has slipped into the bearish range of 20.00-40.00, which indicates more downside ahead.
Gold four-hour chart


© 2000-2026. All rights reserved.
This site is managed by Teletrade D.J. LLC 2351 LLC 2022 (Euro House, Richmond Hill Road, Kingstown, VC0100, St. Vincent and the Grenadines).
The information on this website is for informational purposes only and does not constitute any investment advice.
The company does not serve or provide services to customers who are residents of the US, Canada, Iran, The Democratic People's Republic of Korea, Yemen and FATF blacklisted countries.
Making transactions on financial markets with marginal financial instruments opens up wide possibilities and allows investors who are willing to take risks to earn high profits, carrying a potentially high risk of losses at the same time. Therefore you should responsibly approach the issue of choosing the appropriate investment strategy, taking the available resources into account, before starting trading.
Use of the information: full or partial use of materials from this website must always be referenced to TeleTrade as the source of information. Use of the materials on the Internet must be accompanied by a hyperlink to teletrade.org. Automatic import of materials and information from this website is prohibited.
Please contact our PR department if you have any questions or need assistance at pr@teletrade.global.
transfers