- Analytics
- News and Tools
- Market News
- GBP/USD Price Analysis: Hits fresh multi-week low, bears await a break below 50-day SMA
GBP/USD Price Analysis: Hits fresh multi-week low, bears await a break below 50-day SMA
- GBP/USD dives to over a three-week low and is pressured by strong follow-through USD buying.
- The technical setup favours bearish traders and supports prospects for a further near-term fall.
- A move above the ascending channel support breakpoint is needed to negate the bearish bias.
The GBP/USD pair comes under intense selling pressure on Thursday and drops to over a three-week low, around the 1.2415-1.2410 region during the early North American session.
A combination of supporting factors pushes the US Dollar (USD) to a nearly two-month high, which, in turn, is seen exerting heavy downward pressure on the GBP/USD pair. Against the backdrop of expectations that the Federal Reserve (Fed) will keep interest rates higher for longer, the latest optimism over the US debt ceiling remains supportive of elevated US Treasury bond yields. This, along with a softer tone around the equity markets, lends additional support to the safe-haven Greenback.
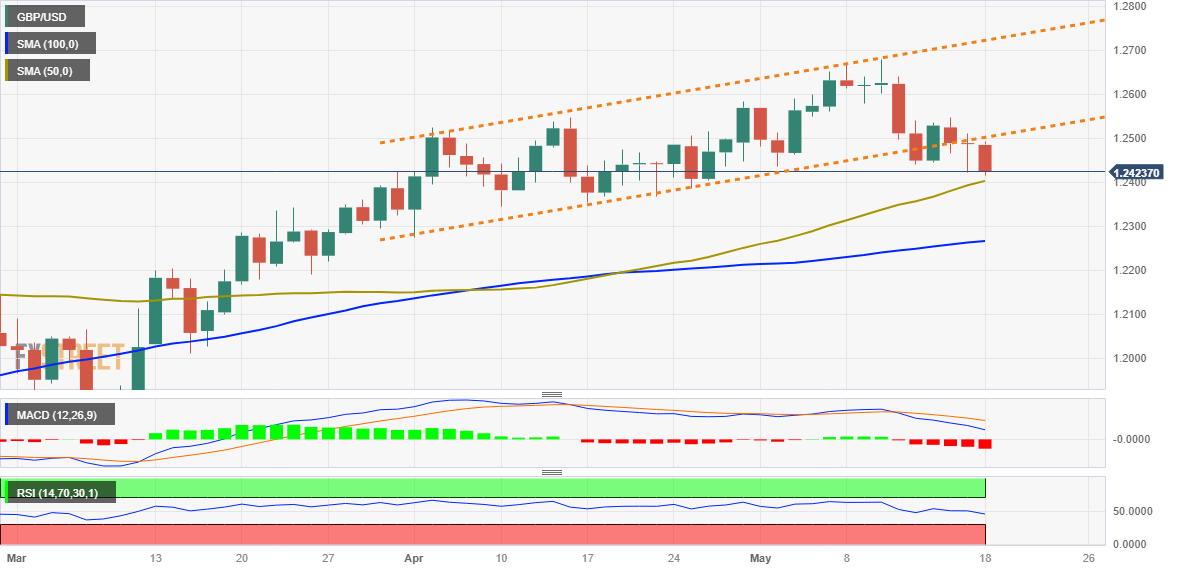
From a technical perspective, the emergence of fresh selling around the GBP/USD pair on Thursday reaffirms the recent break through the lower end of over a one-month-old ascending trend channel. Moreover, oscillators on the daily chart have started drifting in the bearish territory and add credence to the negative outlook. That said, it will be prudent to wait for some follow-through weakness below the 1.2400 mark, or the 50-day Simple Moving Average (SMA), before placing fresh bearish bets.
The GBP/USD pair might then accelerate the downfall towards the next relevant support near the 1.2375-1.2370 region before eventually dropping to the 1.2300 mark. A convincing break below the latter will set the stage for an extension of the recent sharp retracement slide from over a one-year high, around the 1.2680 region touched earlier this month.
On the flip side, any meaningful recovery attempt might now attract fresh sellers ahead of the 1.2500 psychological mark and remain capped near the 1.2530 support-turned-resistance. That said, a sustained strength beyond could trigger a fresh bout of a short-covering and allow the GBP/USD pair to reclaim the 1.2600 round figure. The momentum could get extended further towards the 1.2625-1.2630 intermediate hurdle, above which bulls might aim to retest the YTD peak, around the 1.2680 area.
GBP/USD daily chart
Key levels to watch


© 2000-2026. All rights reserved.
This site is managed by Teletrade D.J. LLC 2351 LLC 2022 (Euro House, Richmond Hill Road, Kingstown, VC0100, St. Vincent and the Grenadines).
The information on this website is for informational purposes only and does not constitute any investment advice.
The company does not serve or provide services to customers who are residents of the US, Canada, Iran, The Democratic People's Republic of Korea, Yemen and FATF blacklisted countries.
Making transactions on financial markets with marginal financial instruments opens up wide possibilities and allows investors who are willing to take risks to earn high profits, carrying a potentially high risk of losses at the same time. Therefore you should responsibly approach the issue of choosing the appropriate investment strategy, taking the available resources into account, before starting trading.
Use of the information: full or partial use of materials from this website must always be referenced to TeleTrade as the source of information. Use of the materials on the Internet must be accompanied by a hyperlink to teletrade.org. Automatic import of materials and information from this website is prohibited.
Please contact our PR department if you have any questions or need assistance at pr@teletrade.global.
transfers