- Analytics
- News and Tools
- Market News
- USD/CAD Price Analysis: Shifts auction below 1.3500 as oil rebounds and USD Index retreats
USD/CAD Price Analysis: Shifts auction below 1.3500 as oil rebounds and USD Index retreats
- USD/CAD has slipped sharply below 1.3500 amid a sharp recovery in the oil price upside exhaustion in the USD Index.
- Monthly Canadian Retail Sales data is seen contracting by 1.4% vs. a contraction of 0.2% recorded earlier.
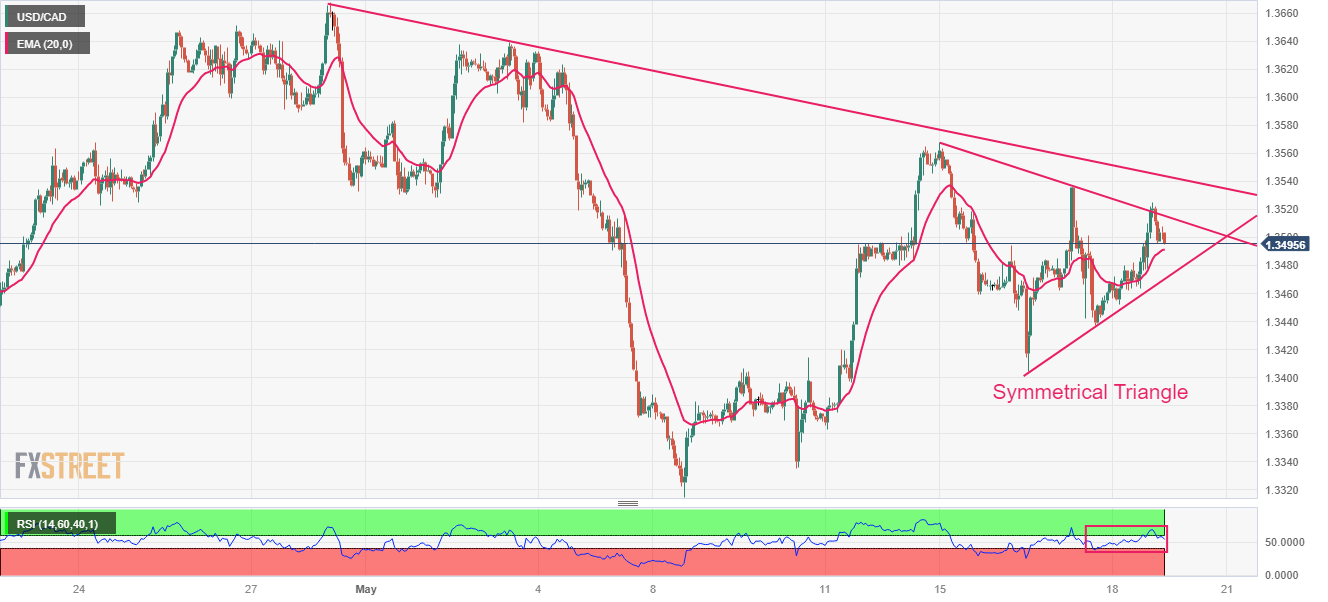
- USD/CAD is auctioning in a Symmetrical Triangle chart pattern, which indicates a volatility contraction.
The USD/CAD pair has dropped below the psychological support of 1.3500 in the early Tokyo session. The Loonie asset has sensed selling pressure as the oil price has rebounded sharply above $72.00 amid optimism over the US borrowing cap raise and the US Dollar Index (DXY) has retreated after a less-confident pullback.
Investors should note that Canada is the leading exporter of oil to the United States and a recovery in the oil price supports the Canadian Dollar.
Going forward, investors will keep an eye on monthly Canadian Retail Sales data (March). Monthly Retail Sales data is seen contracting by 1.4% vs. a contraction of 0.2% recorded earlier. A decline in househoulds’ demand would allow the Bank of Canada (BoC) to keep its interest rate policy steady further.
USD/CAD is auctioning in a Symmetrical Triangle chart pattern on an hourly scale, which indicates a volatility contraction. The Loonie asset sensed selling pressure while attempting a breakout of the neutral triangle. The downward-sloping trendline from April 28 high at 1.3668 is acting as a major barricade for the US Dollar bulls.
The 20-period Exponential Moving Average (EMA) at 1.3492 is close to the asset price, indicating a lackluster performance.
Also, the Relative Strength Index (RSI) (14) has slipped back into the 40.00-60.00 range, which signals that investors await a potential trigger for a decisive move.
The upside bias will get strengthened if the Loonie asset manages to surpass the round-level resistance of 1.3600. This will expose the asset to May 21 low at 1.3644 followed by the round-level resistance at 1.3700.
On the flip side, a break below May 18 low at 1.3452 will fade the upside bias and will drag the asset toward April 04 low at 1.3406 and May 08 low at 1.3315.
USD/CAD hourly chart


© 2000-2026. All rights reserved.
This site is managed by Teletrade D.J. LLC 2351 LLC 2022 (Euro House, Richmond Hill Road, Kingstown, VC0100, St. Vincent and the Grenadines).
The information on this website is for informational purposes only and does not constitute any investment advice.
The company does not serve or provide services to customers who are residents of the US, Canada, Iran, The Democratic People's Republic of Korea, Yemen and FATF blacklisted countries.
Making transactions on financial markets with marginal financial instruments opens up wide possibilities and allows investors who are willing to take risks to earn high profits, carrying a potentially high risk of losses at the same time. Therefore you should responsibly approach the issue of choosing the appropriate investment strategy, taking the available resources into account, before starting trading.
Use of the information: full or partial use of materials from this website must always be referenced to TeleTrade as the source of information. Use of the materials on the Internet must be accompanied by a hyperlink to teletrade.org. Automatic import of materials and information from this website is prohibited.
Please contact our PR department if you have any questions or need assistance at pr@teletrade.global.
transfers