- Analytics
- News and Tools
- Market News
- Gold Price Forecast: XAU/USD attempts recovery below $1,960 as USD Index turns sideways ahead of Fed speech
Gold Price Forecast: XAU/USD attempts recovery below $1,960 as USD Index turns sideways ahead of Fed speech
- Gold price has shown a recovery move after gauging support below $1,960.00 as the USD index is losing upside momentum.
- Investors are expecting neutral policy guidance from Fed’s Powell.
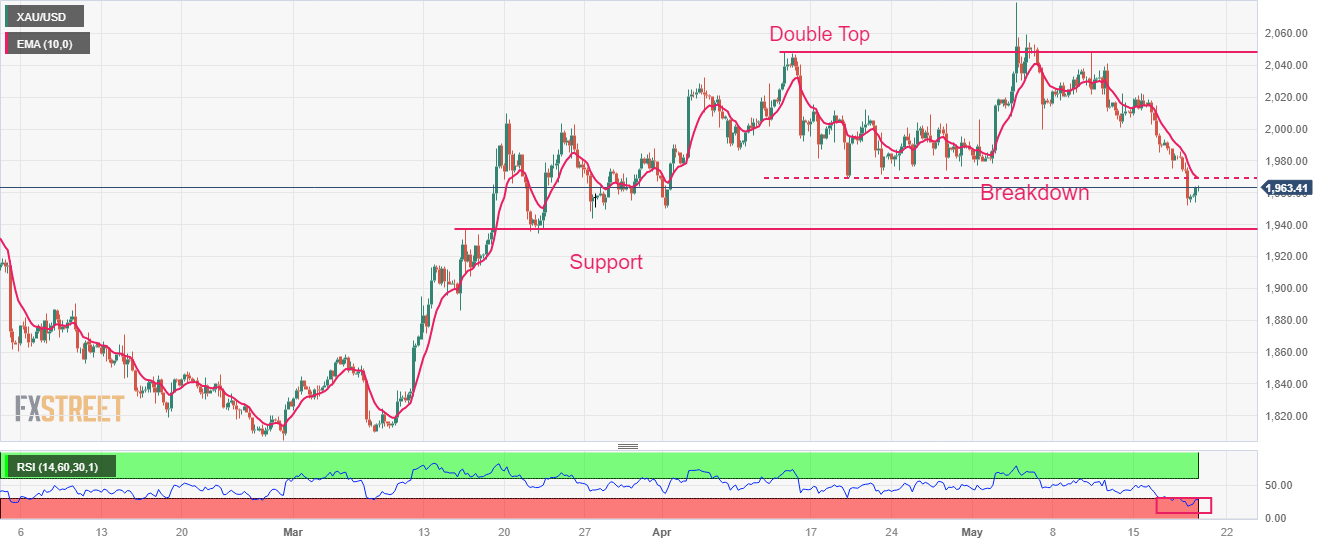
- Gold price has witnessed an immense sell-off after a breakdown of the Double Top chart pattern, which indicates a bearish reversal.
Gold price (XAU/USD) has shown a recovery move after gauging support below $1,960.00 in the early European session. Consideration of a reversal by the precious metal would be too early as optimism over US debt-ceiling issues still persists. Apart from that, the speech from Federal Reserve (Fed) chair Jerome Powell is also improving the appeal for the US Dollar.
S&P500 futures have carry-forwarded gains to Europe added in Asia, portraying a higher risk-appetite of market participants. The US Dollar Index (DXY) is displaying a sideways performance in a narrow range below 103.60. The USD index has shifted to the sidelines ahead of the Fed Powell.
The street is eyeing guidance on interest rates for June monetary policy meeting. Investors are expecting neutral policy guidance as United States inflation is consistently declining, labor market conditions have eased some heat, and small-scale firms are suffering with tight working capital due to stiff credit conditions by the US regional banks.
Investors are optimistic that the US debt-ceiling will get raised even if the bipartisan between the White House and Republican leaders fails as US President Joe Biden would exercise his 14th Amendment right.
Gold technical analysis
Gold price has witnessed an immense sell-off after a breakdown of the Double Top chart pattern formed on a four-hour scale, which indicates a bearish reversal. The Double Top pattern activated after the Gold price exploded the crucial support plotted from April 19 low at $1,969.26. Potential support is placed from March 15 high at $1,937.39.
The 10-period Exponential Moving Average (EMA) at $1,969.25 has restricted the upside for the Gold bulls.
Also, the Relative Strength Index (RSI) (14) has shifted into the bearish range of 20.00-40.00, signaling sheer weakness ahead.
Gold four-hour chart


© 2000-2026. All rights reserved.
This site is managed by Teletrade D.J. LLC 2351 LLC 2022 (Euro House, Richmond Hill Road, Kingstown, VC0100, St. Vincent and the Grenadines).
The information on this website is for informational purposes only and does not constitute any investment advice.
The company does not serve or provide services to customers who are residents of the US, Canada, Iran, The Democratic People's Republic of Korea, Yemen and FATF blacklisted countries.
Making transactions on financial markets with marginal financial instruments opens up wide possibilities and allows investors who are willing to take risks to earn high profits, carrying a potentially high risk of losses at the same time. Therefore you should responsibly approach the issue of choosing the appropriate investment strategy, taking the available resources into account, before starting trading.
Use of the information: full or partial use of materials from this website must always be referenced to TeleTrade as the source of information. Use of the materials on the Internet must be accompanied by a hyperlink to teletrade.org. Automatic import of materials and information from this website is prohibited.
Please contact our PR department if you have any questions or need assistance at pr@teletrade.global.
transfers