- Analytics
- News and Tools
- Market News
- Silver Price Analysis: XAG/USD floats around $23.60, as high US bond yields dented
Silver Price Analysis: XAG/USD floats around $23.60, as high US bond yields dented
- Silver prices edge toward $23.60 following a dip below $24.00 last week, as US Treasury bond yields surge to 3.721%, curbing safe-haven appetite and softening the USD’s fall.
- XAG/USD holds its double-top chart pattern below the neckline. Although a failure to cross the 100-day EMA at $23.50 hints at the bullish sentiment, a bearish RSI suggests possible retesting.
- If XAG/USD breaks below the 100-day EMA, it eyes $23.00 and then the pivotal 200-day EMA at $22.82.
Silver price retraces toward the $23.60 area after falling below the $24.00 figure in the last week, courtesy of higher US Treasury bond yields, with the 10-year benchmark note rate at 3.721%, climbing more than four basis points. That dented the appetite for safe-haven assets, namely Gold and Silver prices, and cushioned the fall of the US Dollar. At the time of writing, the XAG/USD is trading at $23.62, almost flat as the Asian session begins.
XAG/USD Price Analysis: Technical outlook
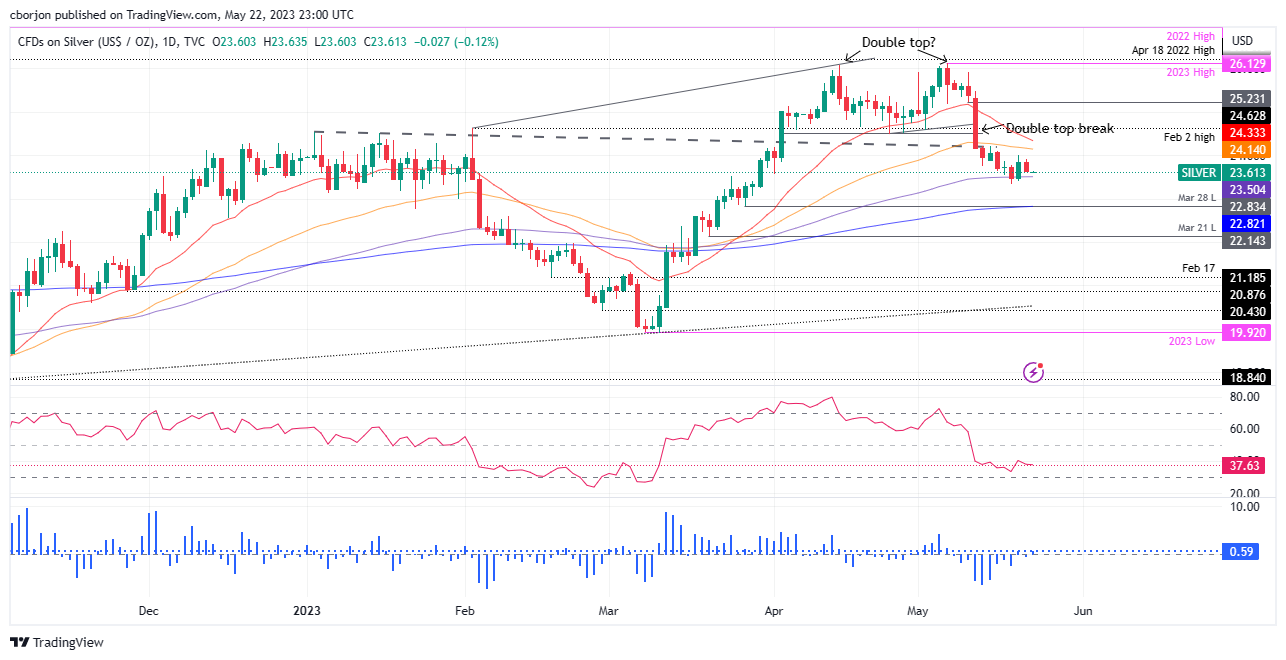
The XAG/USD continues to validate a double-top chart pattern, with the XAG/USD’s spot price remaining below the double-top neckline. Failure to break below the 100-day Exponential Moving Average (EMA) at $23.50 keeps Silver buyers hopeful for higher prices. Nevertheless, the Relative Strength Index (RSI) indicator remains bearish, suggesting that the 100-day EMA could be retested soon.
If XAG/USD breaks below the latter, the next support would be the $23.00 figure before testing the “trendsetter” 200-day EMA at $22.82. Once broken, XAG/USD will turn bearish and be exposed to test lower prices. Firstly, the March 28 daily low at $22.83, followed by the March 21 swing low of $22.14.
On the other hand, for XAG/USD’s bullish continuation, Silver must reclaim the $24.00 mark, a troy ounce, followed by the 50-day EMA at $24.14. Once cleared, XAG/USD’s next resistance would be the 20-day EMA at $24.33, ahead of double-top neckline cracking.
XAG/USD Price Action – Daily chart


© 2000-2026. All rights reserved.
This site is managed by Teletrade D.J. LLC 2351 LLC 2022 (Euro House, Richmond Hill Road, Kingstown, VC0100, St. Vincent and the Grenadines).
The information on this website is for informational purposes only and does not constitute any investment advice.
The company does not serve or provide services to customers who are residents of the US, Canada, Iran, The Democratic People's Republic of Korea, Yemen and FATF blacklisted countries.
Making transactions on financial markets with marginal financial instruments opens up wide possibilities and allows investors who are willing to take risks to earn high profits, carrying a potentially high risk of losses at the same time. Therefore you should responsibly approach the issue of choosing the appropriate investment strategy, taking the available resources into account, before starting trading.
Use of the information: full or partial use of materials from this website must always be referenced to TeleTrade as the source of information. Use of the materials on the Internet must be accompanied by a hyperlink to teletrade.org. Automatic import of materials and information from this website is prohibited.
Please contact our PR department if you have any questions or need assistance at pr@teletrade.global.
transfers