- Analytics
- News and Tools
- Market News
- AUD/USD Price Analysis: Rebounds sharply as Aussie PMI remains upbeat
AUD/USD Price Analysis: Rebounds sharply as Aussie PMI remains upbeat
- AUD/USD has shown some resilience above 0.6650 after the release of better-than-projected Aussie PMI data.
- The USD Index has recovered its entire losses posted in early Asia despite the further delay in US debt-ceiling raise.
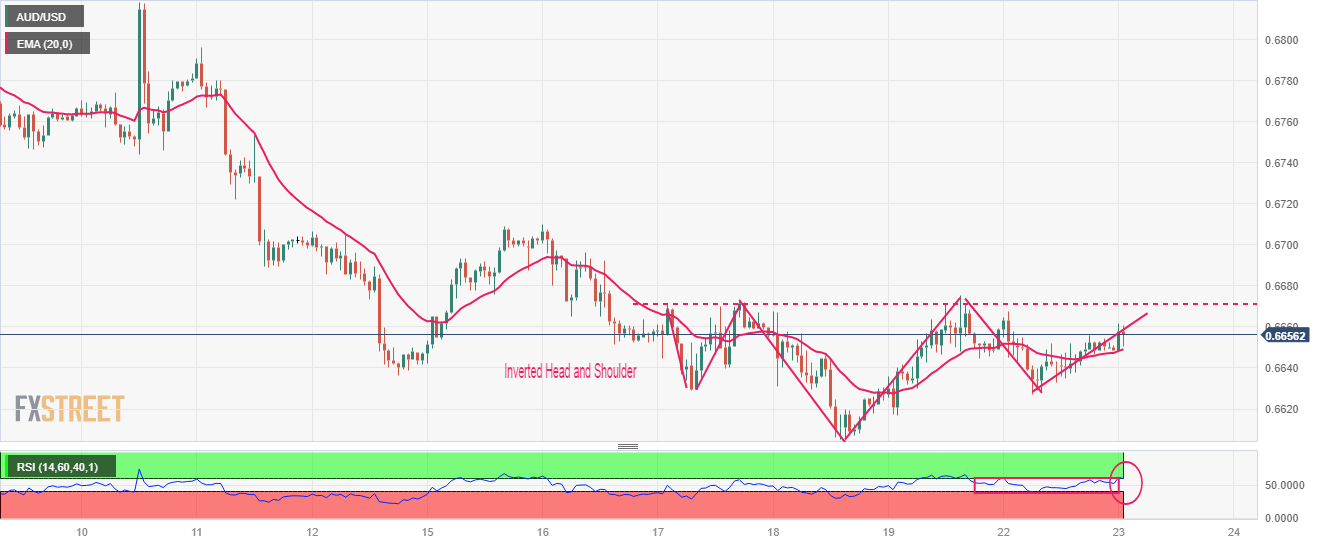
- AUD/USD has formed an Inverted Head and Shoulder pattern, which advocates a bullish reversal after a long consolidation.
The AUD/USD pair has shown a recovery move after correcting to near 0.6650 in the Tokyo session. The Aussie asset has gained some strength despite a solid recovery in the US Dollar Index (DXY). In spite of a further delay in the US debt-ceiling negotiations, as a meeting between US President Joe Biden and House of Speaker Kevin McCarthy ended without an agreement, the USD Index has gained traction.
The release of the upbeat preliminary Australian S&P PMI (May) has infused some strength in the Australian Dollar. Manufacturing PMI has jumped to 48.0 from the expectations of 47.3 but remained in line with the former release. Also, Services PMI outperformed estimates, landed at 51.3.
The USD Index has recovered its entire losses posted in early Asia but is facing barricades in extending its rally further.
AUD/USD has formed an Inverted Head and Shoulder chart pattern on an hourly scale, which advocates a bullish reversal after a long consolidation. The Aussie asset is expected to witness a significant upside after a breakout of the neckline plotted from May 17 high at 0.6690.
The 20-period Exponential Moving Average (EMA) at 0.6650 is providing support to the Aussie bulls.
Also, the Relative Strength Index (RSI) (14) is making efforts for shifting into the bullish range of 60.00-80.00 after which a bullish momentum will get triggered.
A confident acceptance above the neckline plotted from May 17 high at 0.6690 will send the Aussie bulls firmly toward the round-level resistance at 0.6800 followed by February 06 low at 0.6855.
In an alternate scenario, US Dollar bulls will flex their muscles if the Aussie asset will drop below March 15 low at 0.6590. An occurrence of the same will expose the asset to March 08 low at 0.6568 followed by 02 November 2022 high around 0.6500.
AUD/USD hourly chart


© 2000-2026. All rights reserved.
This site is managed by Teletrade D.J. LLC 2351 LLC 2022 (Euro House, Richmond Hill Road, Kingstown, VC0100, St. Vincent and the Grenadines).
The information on this website is for informational purposes only and does not constitute any investment advice.
The company does not serve or provide services to customers who are residents of the US, Canada, Iran, The Democratic People's Republic of Korea, Yemen and FATF blacklisted countries.
Making transactions on financial markets with marginal financial instruments opens up wide possibilities and allows investors who are willing to take risks to earn high profits, carrying a potentially high risk of losses at the same time. Therefore you should responsibly approach the issue of choosing the appropriate investment strategy, taking the available resources into account, before starting trading.
Use of the information: full or partial use of materials from this website must always be referenced to TeleTrade as the source of information. Use of the materials on the Internet must be accompanied by a hyperlink to teletrade.org. Automatic import of materials and information from this website is prohibited.
Please contact our PR department if you have any questions or need assistance at pr@teletrade.global.
transfers