- Analytics
- News and Tools
- Market News
- Gold Price Forecast: XAU/USD grinds near $1,970 amid Fed concerns, debt ceiling woes – Confluence Detector
Gold Price Forecast: XAU/USD grinds near $1,970 amid Fed concerns, debt ceiling woes – Confluence Detector
- Gold Price remains sidelined around key support confluence as markets await for Fed Minutes, US debt ceiling extension.
- Anxiety ahead of the key data/events prods XAU/USD traders amid mixed clues.
- Hawkish Fed bets, hopes of no US default underpin bearish bias about the Gold price.
Gold Price (XAU/USD) treads water around $1,975 heading into Wednesday’s European session. In doing so, the precious metal portrays the market’s inaction amid mixed feelings and cautious mood ahead of the key data/events. That said, the Gold Price previously cheered the US Dollar’s retreat amid a deadlock in the talks to resolve the debt ceiling problem. Also likely to prod the US Dollar bulls is the latest retreat in the US Treasury bond yields amid mixed US PMIs, mostly upbeat.
It should be observed that the market sentiment remains sluggish ahead of the US debt ceiling talks and Minutes of the latest Federal Open Market Committee (FOMC) Monetary Policy Meeting.
Also read: Gold Price Forecast: XAU/USD holds within familiar level ahead of FOMC Minutes
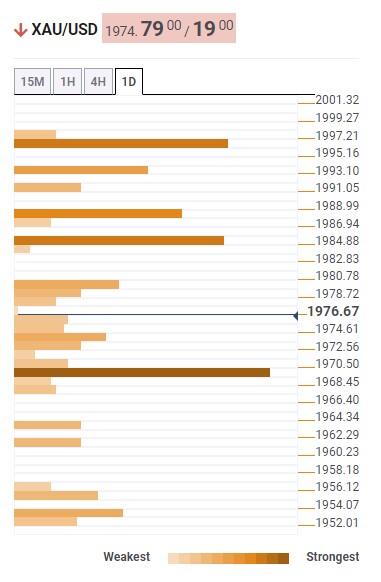
Gold Price: Key levels to watch
Our Technical Confluence Indicator signals that the Gold price seesaws around $1,970 support confluence comprising a middle band of the Bollinger on four-hour, Fibonacci 38.2% on one day and 23.6% on one-week.
In a case where the Gold Price remains bearish past $1,970, the odds of witnessing a slump toward the late swing low of $1,934 can’t be ruled out.
However, the lower band of the Bollinger on the Daily chart, around $1,950, may act as an intermediate halt during the XAU/USD’s fall between $1,970 and $1,934.
Alternatively, Pivot Point one-day R1 and the upper line of the Bollinger on the four-hour chart, around $1,985, caps the immediate upside of the Gold price.
Following that, Fibonacci 61.8% on one-week, around $1,997, will precede the $2,000 round figure to prod the XAU/USD buyers.
Here is how it looks on the tool
About Technical Confluences Detector
The TCD (Technical Confluences Detector) is a tool to locate and point out those price levels where there is a congestion of indicators, moving averages, Fibonacci levels, Pivot Points, etc. If you are a short-term trader, you will find entry points for counter-trend strategies and hunt a few points at a time. If you are a medium-to-long-term trader, this tool will allow you to know in advance the price levels where a medium-to-long-term trend may stop and rest, where to unwind positions, or where to increase your position size


© 2000-2026. All rights reserved.
This site is managed by Teletrade D.J. LLC 2351 LLC 2022 (Euro House, Richmond Hill Road, Kingstown, VC0100, St. Vincent and the Grenadines).
The information on this website is for informational purposes only and does not constitute any investment advice.
The company does not serve or provide services to customers who are residents of the US, Canada, Iran, The Democratic People's Republic of Korea, Yemen and FATF blacklisted countries.
Making transactions on financial markets with marginal financial instruments opens up wide possibilities and allows investors who are willing to take risks to earn high profits, carrying a potentially high risk of losses at the same time. Therefore you should responsibly approach the issue of choosing the appropriate investment strategy, taking the available resources into account, before starting trading.
Use of the information: full or partial use of materials from this website must always be referenced to TeleTrade as the source of information. Use of the materials on the Internet must be accompanied by a hyperlink to teletrade.org. Automatic import of materials and information from this website is prohibited.
Please contact our PR department if you have any questions or need assistance at pr@teletrade.global.
transfers