- Analytics
- News and Tools
- Market News
- GBP/JPY Price Analysis: Clings to 172.00 on risk-off impulse, as UK’s inflation remains high
GBP/JPY Price Analysis: Clings to 172.00 on risk-off impulse, as UK’s inflation remains high
- Despite trading within a range, the GBP/JPY maintains an upward bias, bolstered by UK inflation figures and expectations of further tightening by the Bank of England.
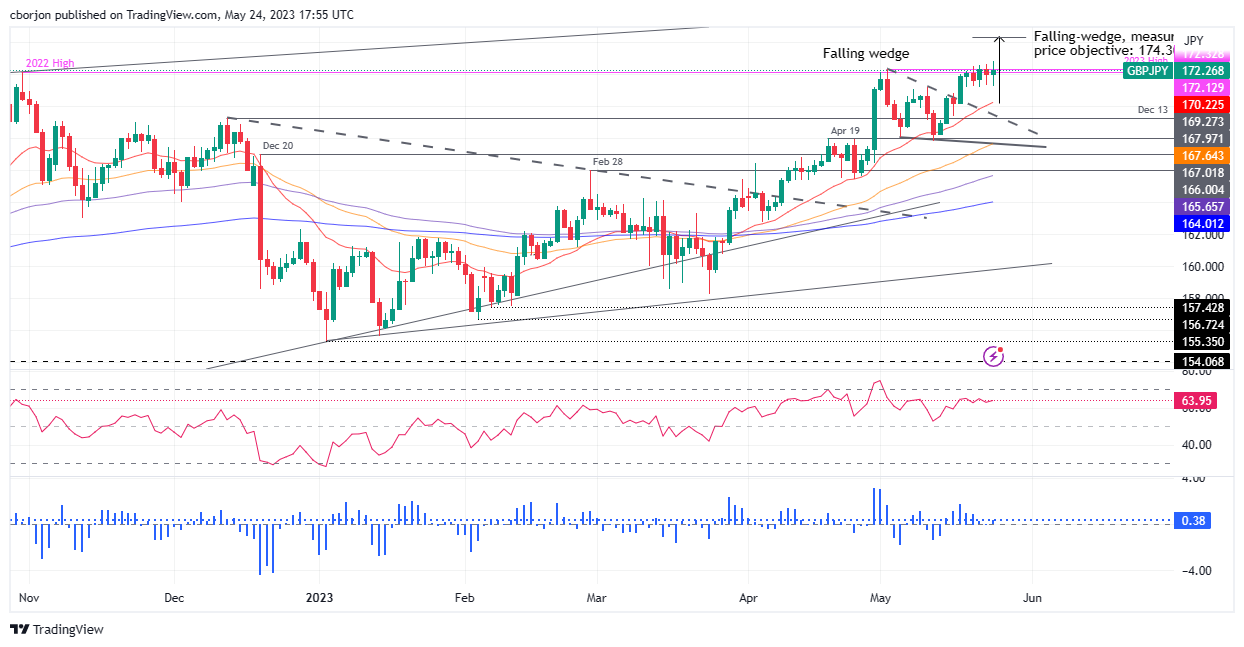
- GBP/JPY faces a potential pullback, suggested by the negative divergence between its price action and the Relative Strength Index (RSI), with support at 172.00 and the 20-day EMA at 170.27.
- Further gains may be expected if GBP/JPY surpasses 173.00, with the falling wedge measuring an objective of 174.30.
GBP/JPY clings to the 172.00 figure amidst a risk-off impulse as the US debt ceiling woes and the release of the US Federal Reserve (Fed) May minutes loom. Therefore, investors seeking safety moved toward safe-haven peers, except for the Japanese Yen (JPY), weakening against the Pound Sterling (GBP). At the time of writing, the GBP/JPY is trading around 172.30s.
GBP/JPY Price Analysis: Technical outlook
The GBP/JPY continues to trade within a range between the 171.22-172.79 area after inflation figures in the United Kingdom (UK) cooled down, except for the April Core Consumer Price Index (CPI) jumping by 6.8%, above the prior’s month and the consensus 6.2%. That underpinned the GBP as expectations for additional tightening by the Bank of England (BoE) increased.
The GBP/JPY is still upward biased, but since the break of a falling wedge, the pair’s rally towards the measured objective at 174.30 stalled. In n article written on May 23, I wrote: “After three consecutive sessions, the GBP/JPY failed to reach the 173.00 area, which, once cleared, could pave the way towards the 174.00 figure, ahead of getting the measured objective of the falling wedge.” However, Wednesday what no exception to the rule, as the GBP/JPY reached a high of 172.79 but retreated more than 50 pips, oscillating around 172.20s.
As the GBP/JPY price action achieved successive higher highs, the Relative Strength Index (RSI) indicator prints lower peaks. That means a negative divergence between price action and the RSI could open the door for a pullback.
Hence, the GBP/JPY first support is the 172.00 mark. A break below and the GBP/JPY will reach the 20-day Exponential Moving Average (EMA) at 170.27, with the 170.00 figure up for grabs.
On the flip side, if GBP/JPY hits 173.00, that could pave the way for further gains, lile the falling wedge measured an objective of 174.30.
GBP/JPY Price Action – Daily chart


© 2000-2026. All rights reserved.
This site is managed by Teletrade D.J. LLC 2351 LLC 2022 (Euro House, Richmond Hill Road, Kingstown, VC0100, St. Vincent and the Grenadines).
The information on this website is for informational purposes only and does not constitute any investment advice.
The company does not serve or provide services to customers who are residents of the US, Canada, Iran, The Democratic People's Republic of Korea, Yemen and FATF blacklisted countries.
Making transactions on financial markets with marginal financial instruments opens up wide possibilities and allows investors who are willing to take risks to earn high profits, carrying a potentially high risk of losses at the same time. Therefore you should responsibly approach the issue of choosing the appropriate investment strategy, taking the available resources into account, before starting trading.
Use of the information: full or partial use of materials from this website must always be referenced to TeleTrade as the source of information. Use of the materials on the Internet must be accompanied by a hyperlink to teletrade.org. Automatic import of materials and information from this website is prohibited.
Please contact our PR department if you have any questions or need assistance at pr@teletrade.global.
transfers