- Analytics
- News and Tools
- Market News
- Gold Price Forecast: XAU/USD stabilizes below $1,960 as USD Index refreshes day high, US Durables eyed
Gold Price Forecast: XAU/USD stabilizes below $1,960 as USD Index refreshes day high, US Durables eyed
- Gold price has shifted its auction below $1,960.00 amid sheer strength in the USD Index.
- Fed policymakers believe that further rate hike in June is ‘less certain’ due to the banking fiasco.
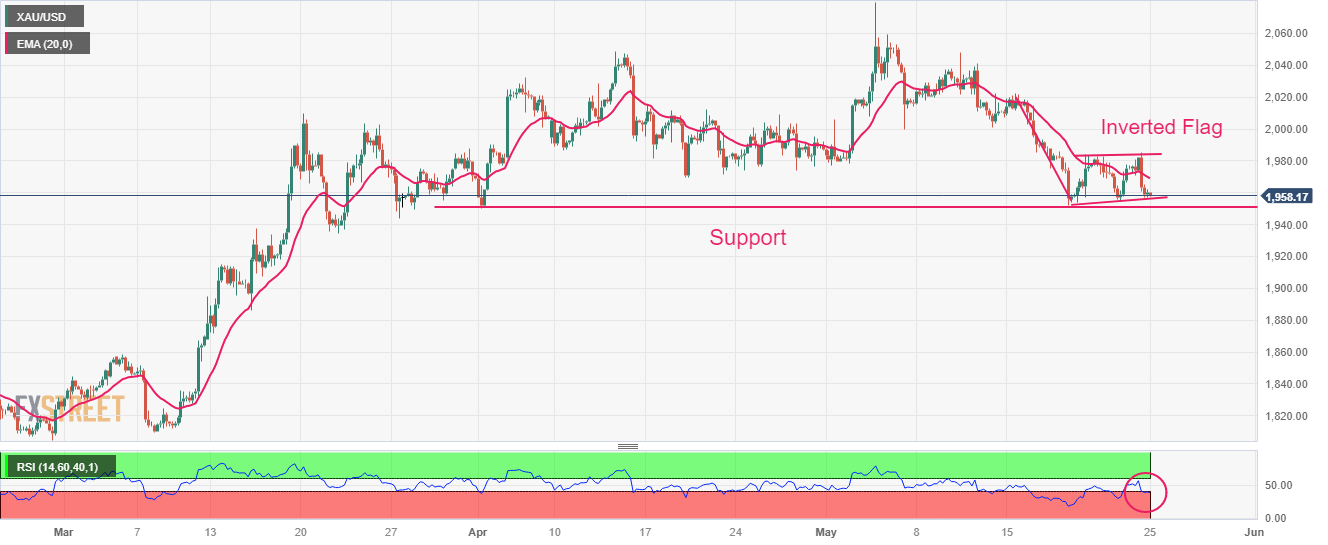
- Gold price is forming an Inverted Flag pattern, which is a trend continuation pattern in which a long consolidation is followed by a breakdown.
Gold price (XAU/USD) has shifted its placement below $1,960.00 in the Asian session. The precious metal is looking to deliver more downside as the US Dollar Index (DXY) is looking to refresh its 10-week high to 104.00 ahead. The USD Index has shown immense strength as US debt-ceiling issues are not resolved despite long negotiations among the White House and Republican leaders.
S&P500 futures are holding significant gains in the Asian session. US equities have not carry-forwarded weak cues witnessed on Wednesday. The US Dollar Index (DXY) has refreshed its day’s high at 103.92 as uncertainty for US borrowing cap issues is escalating.
US House of Representatives Kevin McCarthy refused to support additional taxes for the Wealthy community and higher budget spending, which has delayed issues further, however, he remained confident that a bipartisan will be reached.
Gold price has failed to capitalize on dovish cues for interest rate guidance in the Federal Open Market Committee (FOMC) minutes. Federal Reserve (Fed) policymakers believe that further rate hike in June is ‘less certain’ due to a potential banking fiasco.
Later this week, US Durable Goods Orders data will be keenly watched. The economic data is seen contracting by 1.0% vs. an expansion of 3.2%.
Gold technical analysis
Gold price is forming an Inverted Flag chart pattern on a four-hour scale, which is a trend continuation pattern in which a long consolidation is followed by a breakdown. The Gold price is hovering above the horizontal support plotted from April 03 low at $1,949.83.
The 20-period Exponential Moving Average (EMA) at $1,969.26 is barricading the Gold price from any rally.
Meanwhile, the Relative Strength Index (RSI) (14) has slipped below 40.00, which indicates that the downside momentum is warranted.
Gold four-hour chart


© 2000-2026. All rights reserved.
This site is managed by Teletrade D.J. LLC 2351 LLC 2022 (Euro House, Richmond Hill Road, Kingstown, VC0100, St. Vincent and the Grenadines).
The information on this website is for informational purposes only and does not constitute any investment advice.
The company does not serve or provide services to customers who are residents of the US, Canada, Iran, The Democratic People's Republic of Korea, Yemen and FATF blacklisted countries.
Making transactions on financial markets with marginal financial instruments opens up wide possibilities and allows investors who are willing to take risks to earn high profits, carrying a potentially high risk of losses at the same time. Therefore you should responsibly approach the issue of choosing the appropriate investment strategy, taking the available resources into account, before starting trading.
Use of the information: full or partial use of materials from this website must always be referenced to TeleTrade as the source of information. Use of the materials on the Internet must be accompanied by a hyperlink to teletrade.org. Automatic import of materials and information from this website is prohibited.
Please contact our PR department if you have any questions or need assistance at pr@teletrade.global.
transfers