- Analytics
- News and Tools
- Market News
- Gold Price Forecast: XAU/USD slips below $1,940 amid US default jitters, US Durables in focus
Gold Price Forecast: XAU/USD slips below $1,940 amid US default jitters, US Durables in focus
- Gold price has dropped after struggling above $1,940.00 as the US Dollar Index is possessing immense strength.
- Fed Collins cited that the Fed "may be at or near" the time to pause interest rate increases.
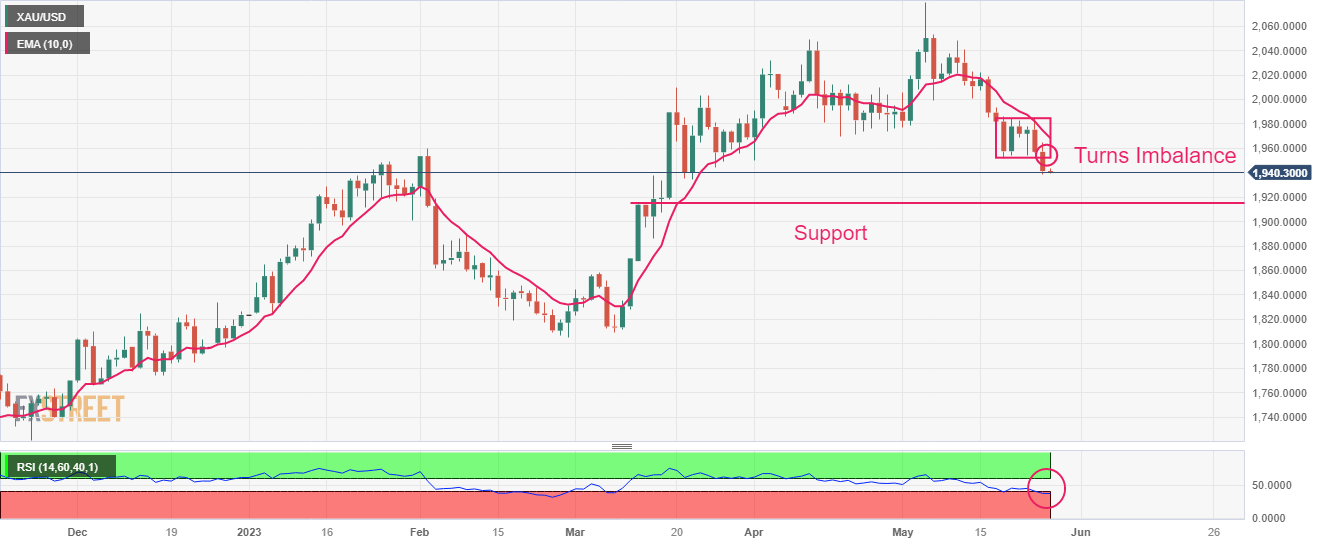
- Gold price has turned imbalance after a breakdown of the consolidation formed in a range of $1,952-1,985.
Gold price (XAU/USD) has extended its downside further below the immediate support of $1,940.00 in the Asian session. Earlier, the precious metal displayed a vertical downfall after slipping below the $1,952.00 cushion as the United States economy is approaching a default situation amid divergence in views over the budget among the White House and Republican delegates.
S&P500 futures have posted decent losses in the Asian session after a positive Thursday. Market sentiment is turning negative as investors are worried that the US treasury could announce a default in less than one week if negotiations between US President Joe Biden and House of Representatives Kevin McCarthy keep going like this.
The US Dollar Index (DXY) has rebounded firmly to near 104.28 after a mild correction. The USD Index is having immense strength despite expectations of a pause in the policy-tightening spell by the Federal Reserve (Fed) in June. Boston Fed Bank President Susan Collins said on Thursday that the Fed "may be at or near" the time to pause interest rate increases, as reported by Reuters. She further added, "While inflation is still too high, there are some promising signs of moderation,"
On Friday, US Durable Goods Orders data will be keenly watched. According to the consensus, Aril Durable Goods Orders data is seen contracting by 1.0% against an expansion of 3.2%. A decline in durable goods orders would weigh heavily on the core Consumer Price Index (CPI) which has shown severe persistence.
Gold technical analysis
Gold price has turned imbalance after a breakdown of the consolidation formed in a range of $1,952-1,985 on the daily scale. The precious metal has shifted into bearish territory and is expected to find support near May 13 high at $1,914.67.
The 10-period Exponential Moving Average (EMA) at $1,968.43 is acting as a barricade for the Gold bulls.
The Relative Strength Index (RSI) (14) has slipped below 40.00, showing no signs of divergence and an absence of evidence of oversold situation supports weakness ahead.
Gold daily chart


© 2000-2026. All rights reserved.
This site is managed by Teletrade D.J. LLC 2351 LLC 2022 (Euro House, Richmond Hill Road, Kingstown, VC0100, St. Vincent and the Grenadines).
The information on this website is for informational purposes only and does not constitute any investment advice.
The company does not serve or provide services to customers who are residents of the US, Canada, Iran, The Democratic People's Republic of Korea, Yemen and FATF blacklisted countries.
Making transactions on financial markets with marginal financial instruments opens up wide possibilities and allows investors who are willing to take risks to earn high profits, carrying a potentially high risk of losses at the same time. Therefore you should responsibly approach the issue of choosing the appropriate investment strategy, taking the available resources into account, before starting trading.
Use of the information: full or partial use of materials from this website must always be referenced to TeleTrade as the source of information. Use of the materials on the Internet must be accompanied by a hyperlink to teletrade.org. Automatic import of materials and information from this website is prohibited.
Please contact our PR department if you have any questions or need assistance at pr@teletrade.global.
transfers