- Analytics
- News and Tools
- Market News
- Silver Price Analysis: XAG/USD climbs back closer to 100-day SMA support breakpoint
Silver Price Analysis: XAG/USD climbs back closer to 100-day SMA support breakpoint
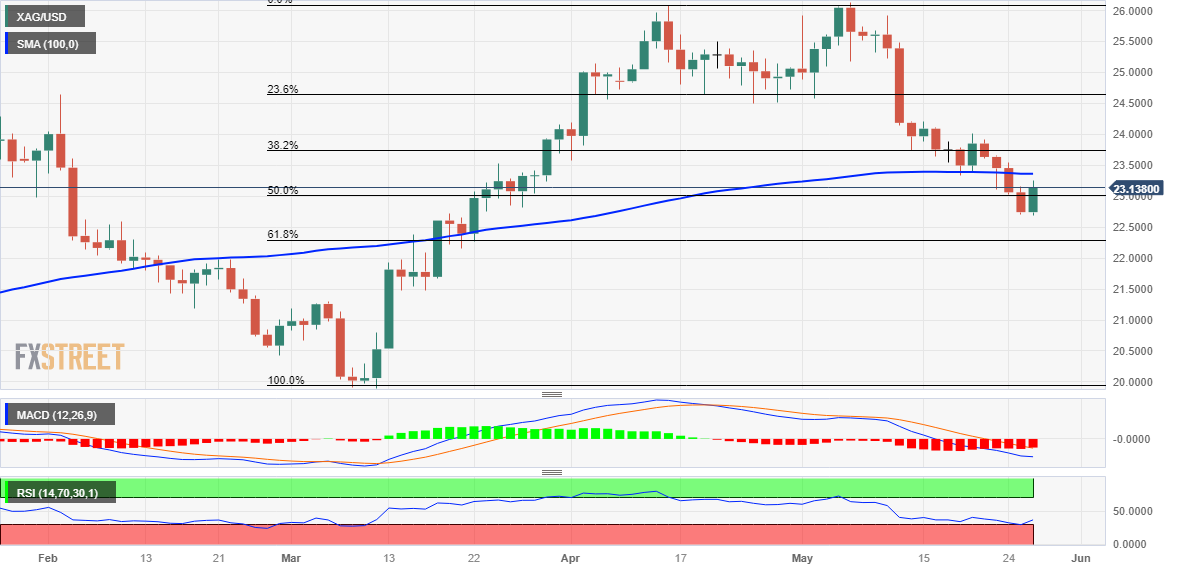
- Silver stages a solid rebound from over a two-month low touched this Friday.
- The setup warrants some caution before positioning for any further recovery.
- A sustained move beyond the $24.00 mark could negate the bearish outlook.
Silver gains strong positive traction on Friday and snaps a four-day losing streak to the $22.70-$22.65 area, or over a two-month low touched earlier today. The white metal maintains its bid tone through the early North American session and currently trades around the $23.20-$23.25 zone, up over 2% for the day.
A slightly oversold Relative Strength Index (RSI) on the daily chart turns out to be a key factor that prompts aggressive short-covering around the XAG/USD. That said, this week's convincing break through the 100-day Simple Moving Average (SMA) support and the overnight slide below the 50% Fibonacci retracement level of the March-May rally favour bearish traders. This, in turn, suggests that any subsequent move up might still be seen as a selling opportunity and runs the risk of fizzling out rather quickly.
The 100-day SMA support breakpoint, currently pegged around the $23.35 region, is likely to act as an immediate hurdle. This is followed by 38.2% Fibo. level, near the $23.75 zone, above which the XAG/USD could climb to the $24.00 mark. The latter should act as a pivotal point, which if cleared decisively might trigger a fresh wave of a short-covering move and lift the commodity further beyond the $24.20-$24.25 hurdle. The recovery momentum could get extended towards the $24.50-$24.60 strong support breakpoint.
On the flip side, the monthly low, around the $22.70-$22.65 region, now seems to protect the immediate downside ahead of the 61.8% Fibo. level, near the $22.25 area. Some follow-through selling, leading to a subsequent slide below the $22.00 mark should pave the way for an extension of the recent downfall from over a one-year top touched earlier this month. The XAG/USD might then accelerate the fall towards the $21.55-$21.50 intermediate support before eventually dropping to the $21.00 round-figure mark.
Silver daily chart
Key levels to watch


© 2000-2026. All rights reserved.
This site is managed by Teletrade D.J. LLC 2351 LLC 2022 (Euro House, Richmond Hill Road, Kingstown, VC0100, St. Vincent and the Grenadines).
The information on this website is for informational purposes only and does not constitute any investment advice.
The company does not serve or provide services to customers who are residents of the US, Canada, Iran, The Democratic People's Republic of Korea, Yemen and FATF blacklisted countries.
Making transactions on financial markets with marginal financial instruments opens up wide possibilities and allows investors who are willing to take risks to earn high profits, carrying a potentially high risk of losses at the same time. Therefore you should responsibly approach the issue of choosing the appropriate investment strategy, taking the available resources into account, before starting trading.
Use of the information: full or partial use of materials from this website must always be referenced to TeleTrade as the source of information. Use of the materials on the Internet must be accompanied by a hyperlink to teletrade.org. Automatic import of materials and information from this website is prohibited.
Please contact our PR department if you have any questions or need assistance at pr@teletrade.global.
transfers