- Analytics
- News and Tools
- Market News
- Gold Price Forecast: XAU/USD looks vulnerable above $1,940 as US households’ spending remains resilient
Gold Price Forecast: XAU/USD looks vulnerable above $1,940 as US households’ spending remains resilient
- Gold price has shown topsy-turvy moves above $1,943.00 amid a less volatile action due to the long weekend.
- Fresh incoming data from US economic indicators are hinting at a sharp rise in demand-pull inflation.
- Gold price has again shifted into a volatility contraction and is expected to deliver more downside ahead.
Gold price (XAU/USD) is displaying topsy-turvy moves above $1,943.00 in the early Asian session. The precious metal is expected to extend its downside journey after an intermediate inventory adjustment phase as the Federal Reserve (Fed) is expected to make more interest rate hikes in June meeting certain amid resilient households' spending in the United States.
Earlier, Fed chair Jerome Powell cited that more rate hikes seem less certain as tight credit conditions by US regional banks are effectively restricting inflation. However, fresh incoming data from economic indicators is hinting at a sharp rise in demand-pull inflation.
S&P500 futures are showing gains in early Asia, portraying a risk appetite theme as fears of a default by the US economy have receded. US President Joe Biden made clear on Monday that the agreed proposal between the White House and Republicans is going to Congress for voting before the deadline of June 05.
The US Dollar Index (DXY) is facing barricades in extending its recovery above 104.30. Investors should brace for a volatile action ahead as US markets will open after a long weekend, therefore, investors would first wrap up their positions. Apart from that, investors would shift their focus towards JOLTS Jobs Openings data, which will release on Wednesday along with Fed’s Beige Book. As per the consensus, job openings are expected to fall to 9.35M vs. the prior release of 9.59M.
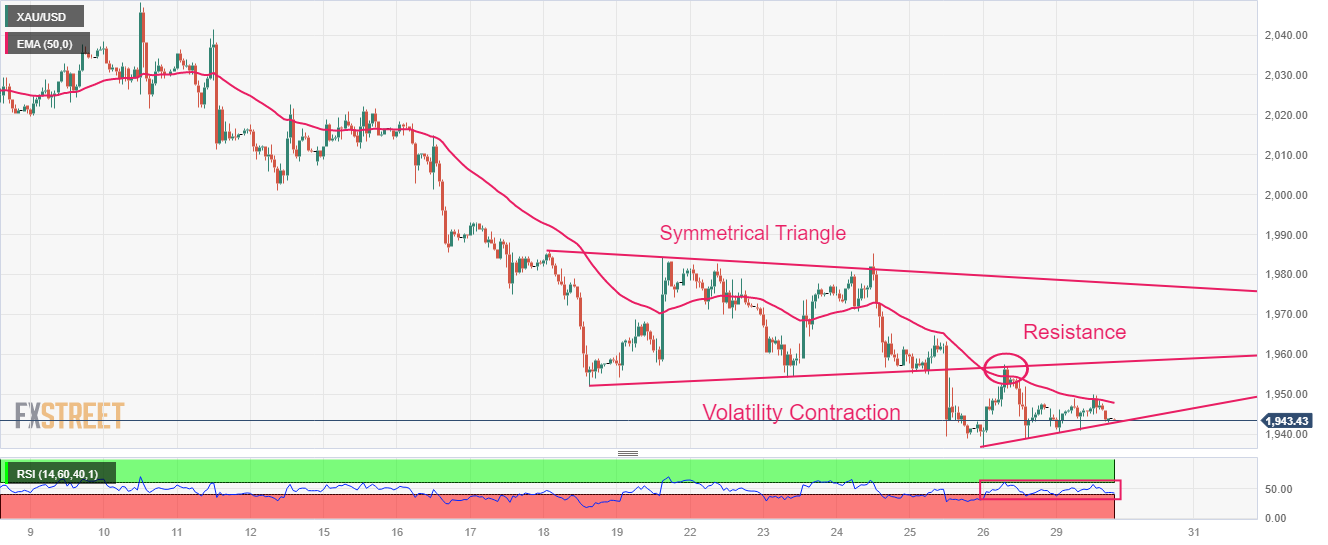
Gold technical analysis
Gold price displayed a downside move after a breakdown of the Symmetrical Triangle chart pattern on an hourly scale. The precious metal has sensed immense selling pressure after a pullback move to near $1,957.82. The yellow metal has again shifted into a volatility contraction and is expected to deliver more downside ahead.
The 50-period Exponential Moving Average (EMA) at $1,948.00 is barricading the upside of the Gold price.
Meanwhile, the Relative Strength Index (RSI) (14) is oscillating in the 40.00-60.00 range. A breakdown below 40.00 will trigger the downside momentum.
Gold hourly chart


© 2000-2026. All rights reserved.
This site is managed by Teletrade D.J. LLC 2351 LLC 2022 (Euro House, Richmond Hill Road, Kingstown, VC0100, St. Vincent and the Grenadines).
The information on this website is for informational purposes only and does not constitute any investment advice.
The company does not serve or provide services to customers who are residents of the US, Canada, Iran, The Democratic People's Republic of Korea, Yemen and FATF blacklisted countries.
Making transactions on financial markets with marginal financial instruments opens up wide possibilities and allows investors who are willing to take risks to earn high profits, carrying a potentially high risk of losses at the same time. Therefore you should responsibly approach the issue of choosing the appropriate investment strategy, taking the available resources into account, before starting trading.
Use of the information: full or partial use of materials from this website must always be referenced to TeleTrade as the source of information. Use of the materials on the Internet must be accompanied by a hyperlink to teletrade.org. Automatic import of materials and information from this website is prohibited.
Please contact our PR department if you have any questions or need assistance at pr@teletrade.global.
transfers