- Analytics
- News and Tools
- Market News
- USD/CAD Price Analysis: At make or a break below 1.3600
USD/CAD Price Analysis: At make or a break below 1.3600
- USD/CAD is oscillating in a narrow range below 1.3600 amid a quiet market mood.
- This week, US Employment-linked economic indicators will keep investors busy.
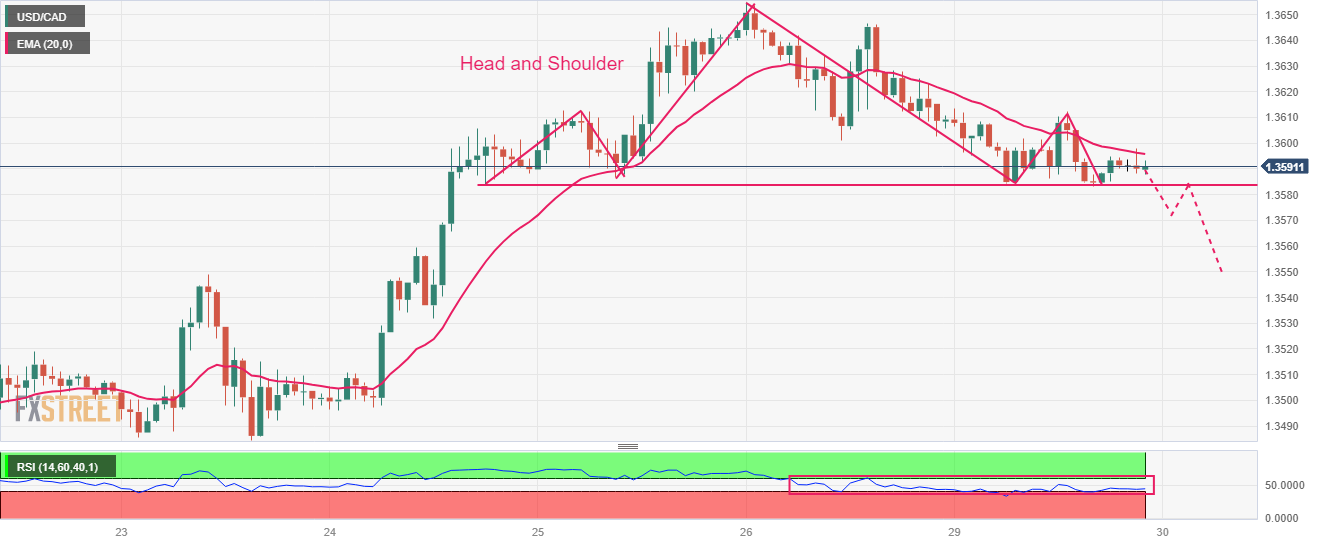
- USD/CAD is hovering near the neckline of the Head and Shoulder chart pattern around 1.3584.
The USD/CAD pair is juggling in a narrow range below the round-level resistance of 1.3600 in the early Tokyo session. The Loonie asset is expected to display a power-pack action as investors would remain highly active after an extended weekend.
As US debt-ceiling raise proposal is finally going to Congress for approval before June 05, investors would shift their focus towards United States Employment-linked economic indicators. After Wednesday’s JOLTS Job Openings data, investors will focus on Thursday’s Automatic Data Processing (ADP) Employment Change and finally on Friday’s Nonfarm Payrolls (NFP) data.
The Canadian Dollar is expected to remain on the tenterhooks amid the release of the Q1 Gross Domestic Product (GDP) data, which will release on Wednesday.
Meanwhile, the US Dollar Index (DXY) has dropped after facing stiff barricades around 104.30.
USD/CAD is hovering near the neckline of the Head and Shoulder chart pattern formed on an hourly scale, which is plotted around 1.3584. A slippage below the neckline support would result in a sheer breakdown. The 20-period Exponential Moving Average (EMA) at 1.3596 is acting as a barricade for the US Dollar bulls.
Meanwhile, the Relative Strength Index (RSI) (14) is oscillating in the 40.00-60.00 range. A downside momentum will get triggered after a breakdown below 40.00.
Going forward, a break below May 29 low at 1.3584 will drag the asset toward May 23 high at 1.3550. A breakdown below the latter will expose the Loonie asset to psychological support at 1.3500.
On the contrary, a fresh buy would come above May 26 high at 1.3655, which would drive the asset toward the round-level resistance at 1.3700 followed by March 27 high at 1.3745.
USD/CAD hourly chart


© 2000-2026. All rights reserved.
This site is managed by Teletrade D.J. LLC 2351 LLC 2022 (Euro House, Richmond Hill Road, Kingstown, VC0100, St. Vincent and the Grenadines).
The information on this website is for informational purposes only and does not constitute any investment advice.
The company does not serve or provide services to customers who are residents of the US, Canada, Iran, The Democratic People's Republic of Korea, Yemen and FATF blacklisted countries.
Making transactions on financial markets with marginal financial instruments opens up wide possibilities and allows investors who are willing to take risks to earn high profits, carrying a potentially high risk of losses at the same time. Therefore you should responsibly approach the issue of choosing the appropriate investment strategy, taking the available resources into account, before starting trading.
Use of the information: full or partial use of materials from this website must always be referenced to TeleTrade as the source of information. Use of the materials on the Internet must be accompanied by a hyperlink to teletrade.org. Automatic import of materials and information from this website is prohibited.
Please contact our PR department if you have any questions or need assistance at pr@teletrade.global.
transfers