- Analytics
- News and Tools
- Market News
- USD/INR Price Analysis: Indian Rupee bears occupy driver’s seat within falling wedge, 82.75 is the key
USD/INR Price Analysis: Indian Rupee bears occupy driver’s seat within falling wedge, 82.75 is the key
- USD/INR picks up bids to extend the previous day’s rebound inside bullish chart formation.
- 50-SMA adds strength to 82.75 hurdle for Indian Rupee bears.
- April’s peak, 200-SMA restrict short-term downside of USD/INR pair.
- US Dollar grinds higher amid default jitters, full markets’ reaction to US debt ceiling deal.
USD/INR remains on the front foot around 82.67 amid the initial hour of the Indian trading session on Tuesday. With this, the Indian Rupee (INR) pair portrays the market’s favor to the US Dollar amid anxiety ahead of the key US jobs report, as well as due to the mixed concerns about the US debt ceiling agreement and its capacity to become the law.
Amid these plays, the US stock futures print mild gains but the Treasury bond yields remain pressured and challenge the US Dollar Index (DXY) bulls as the greenback’s gauge versus the six major currencies seesaws around a nine-week high.
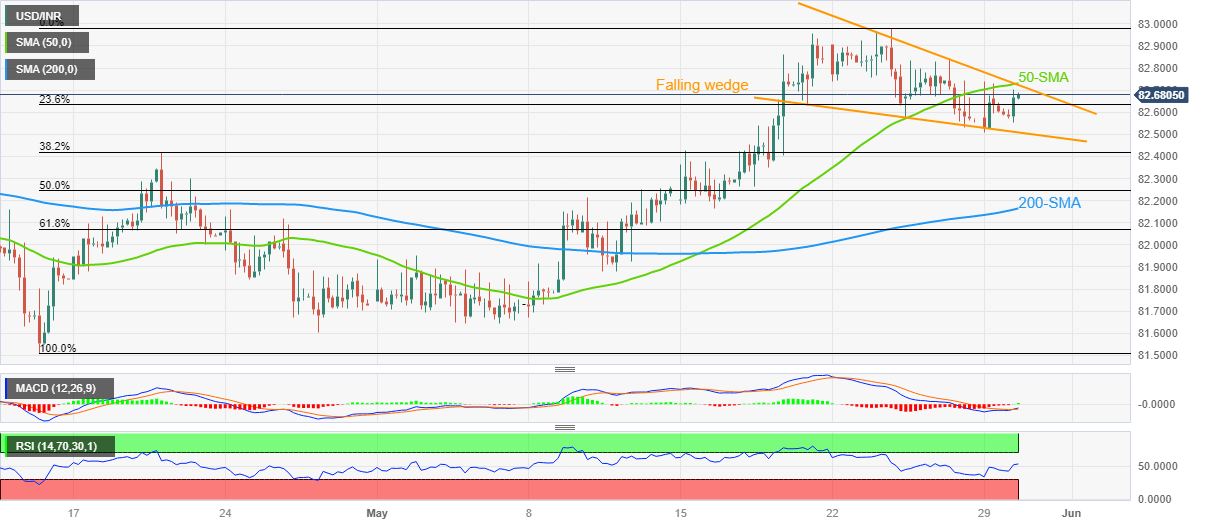
Technically, the USD/INR pair portrays a falling wedge bullish chart formation on the four-hour play, recently approaching the top line of the stated pattern.
It’s worth noting that the recently bullish MACD signals and upbeat RSI (14) line, not overbought, underpin the USD/INR pair’s latest run-up targeting the confirmation of the falling wedge by crossing the 82.75 resistance. Adding strength to the 82.75 hurdle is the 50-bar Simple Moving Average (SMA).
In a case where the USD/INR pair remains strong past 82.75, the monthly peak of around 83.00 may prod the buyers during the theoretical target of the wedge breakout, near 83.25.
Meanwhile, the USD/INR pair’s downside remains limited unless the quote stays beyond the aforementioned wedge’s bottom line, close to 82.50 at the latest.
Even if the USD/INR drops below 82.50, the 200-SMA level of around 82.15 can act as the last defense of the Indian Rupee sellers. It should be observed late April 20 peak of 82.41 also challenges the USD/INR bears.
USD/INR: Four-hour chart
Trend: Further upside expected


© 2000-2026. All rights reserved.
This site is managed by Teletrade D.J. LLC 2351 LLC 2022 (Euro House, Richmond Hill Road, Kingstown, VC0100, St. Vincent and the Grenadines).
The information on this website is for informational purposes only and does not constitute any investment advice.
The company does not serve or provide services to customers who are residents of the US, Canada, Iran, The Democratic People's Republic of Korea, Yemen and FATF blacklisted countries.
Making transactions on financial markets with marginal financial instruments opens up wide possibilities and allows investors who are willing to take risks to earn high profits, carrying a potentially high risk of losses at the same time. Therefore you should responsibly approach the issue of choosing the appropriate investment strategy, taking the available resources into account, before starting trading.
Use of the information: full or partial use of materials from this website must always be referenced to TeleTrade as the source of information. Use of the materials on the Internet must be accompanied by a hyperlink to teletrade.org. Automatic import of materials and information from this website is prohibited.
Please contact our PR department if you have any questions or need assistance at pr@teletrade.global.
transfers