- Analytics
- News and Tools
- Market News
- Gold Price Forecast: XAU/USD retreats from $1,950 as USD Index rebounds firmly, US Employment in focus
Gold Price Forecast: XAU/USD retreats from $1,950 as USD Index rebounds firmly, US Employment in focus
- Gold price has extended its downside to near $1,940.00 amid a solid recovery in the USD Index.
- The overall market mood has turned cautious as investors are anticipating one more interest rate hike from the Fed.
- Gold price has delivered a breakdown of the volatility contraction pattern and is anticipated to deliver a vertical fall
Gold price (XAU/USD) witnessed extreme selling pressure after a short-lived pullback move to near $1,946.70 in the Asian session. The precious metal has extended its downside journey to near $1,940.00 as the US Dollar Index (DXY) has recovered its entire losses and is aiming to print afresh day high above 104.34.
S&P500 futures are continuously easing gains generated on Monday as investors are worried that Tuesday’s trading session could be extremely volatile after an extended weekend. The overall market mood has turned cautious as investors are anticipating one more interest rate elevation from the Federal Reserve (Fed).
Earlier, Fed chair Jerome Powell cited that tight credit conditions by US regional banks are doing the job for the central bank as liquidity disbursement in the economy has dropped. Firms are facing barriers in augmenting working capital requirements and are satisfied with operating at less capacity.
However, fresh incoming data showed that consumer spending is sky-rocketing in the US economy, and labor market conditions have not eased as expected, which is forcing the Fed to continue its policy-tightening spell.
This week, the release of the US Employment data will provide more clarity about interest rate guidance. As per the consensus, Thursday’s Automatic Data Processing (ADP) Employment Change is expected to land at 170K lower than the former release of 296K.
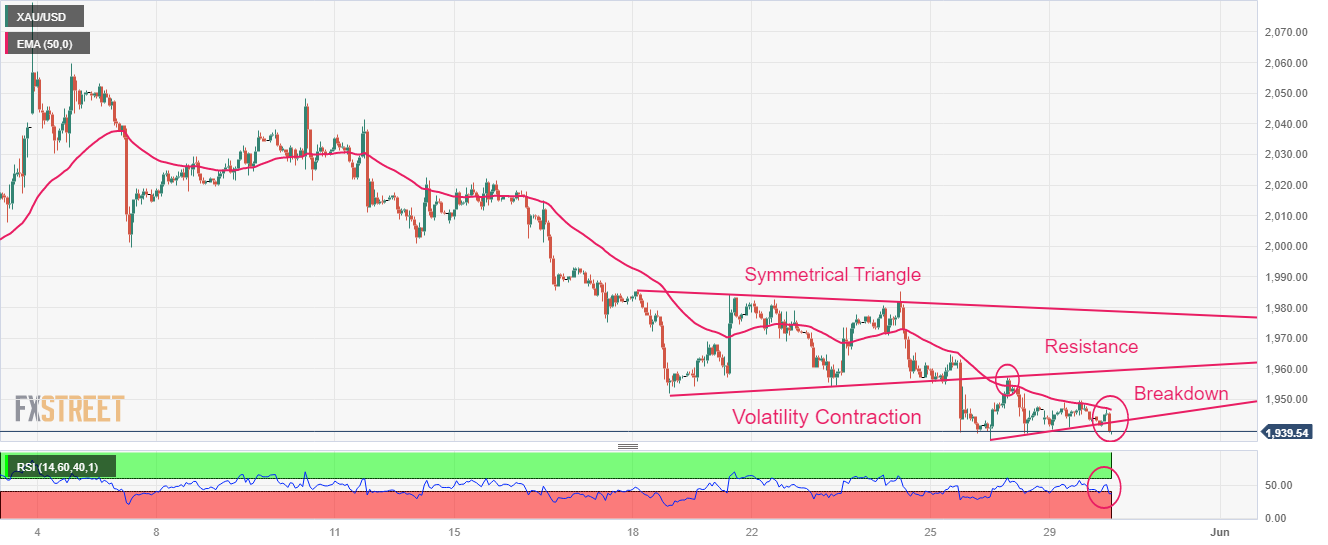
Gold technical analysis
Gold price has delivered a breakdown of the volatility contraction and is anticipated to deliver a vertical fall. Earlier, the precious metal displayed a downside move after a breakdown of the Symmetrical Triangle chart pattern on an hourly scale.
The 50-period Exponential Moving Average (EMA) at $1,948.00 has acted as a barricade for the Gold price.
Meanwhile, the Relative Strength Index (RSI) (14) has slipped below 40.00, which indicates that the downside momentum has been triggered.
Gold hourly chart


© 2000-2026. All rights reserved.
This site is managed by Teletrade D.J. LLC 2351 LLC 2022 (Euro House, Richmond Hill Road, Kingstown, VC0100, St. Vincent and the Grenadines).
The information on this website is for informational purposes only and does not constitute any investment advice.
The company does not serve or provide services to customers who are residents of the US, Canada, Iran, The Democratic People's Republic of Korea, Yemen and FATF blacklisted countries.
Making transactions on financial markets with marginal financial instruments opens up wide possibilities and allows investors who are willing to take risks to earn high profits, carrying a potentially high risk of losses at the same time. Therefore you should responsibly approach the issue of choosing the appropriate investment strategy, taking the available resources into account, before starting trading.
Use of the information: full or partial use of materials from this website must always be referenced to TeleTrade as the source of information. Use of the materials on the Internet must be accompanied by a hyperlink to teletrade.org. Automatic import of materials and information from this website is prohibited.
Please contact our PR department if you have any questions or need assistance at pr@teletrade.global.
transfers