- Analytics
- News and Tools
- Market News
- Gold Price Forecast: XAU/USD juggles around $1,960 after a rally inspired by US Dollar’s correction
Gold Price Forecast: XAU/USD juggles around $1,960 after a rally inspired by US Dollar’s correction
- Gold price is consolidating around $1,960.00 after a vertical rally ahead of US Employment.
- The USD Index witnessed intense selling pressure after printing a fresh 10-week high at 104.50.
- Gold price is gathering strength for a breakout above the trendline plotted from $1,952.00.
Gold price (XAU/USD) has turned sideways around $1,960.00 after failing to extend a rally above $1,963.70 in the early Asian session. A quick rally in the Gold price came after a vertical sell-off in the US Dollar Index (DXY). The USD Index witnessed intense selling pressure after printing a fresh 10-week high at 104.50.
S&P500 ended flat on Tuesday despite after an extended weekend, portraying a cautious market mood. Sheer volatility in the US equities cannot be ruled out ahead of the United States Employment data, which will build a base for June‘s monetary policy meeting by the Federal Reserve (Fed).
Despite a sell-off in the USD Index, investors are confident that the asset could be rerated ahead as one more interest rate hike by the Fed is yet to be discounted. Consumer spending has rebounded dramatically in April and now decent caliber in labor market conditions could force Fed chair Jerome Powell to look for raising interest rates further without any doubt.
On Thursday, US Automatic Data Processing (ADP) Employment data will be keenly watched. As per the consensus, the US economy added 170K jobs in May, lower than the prior addition of 296K. Later on Friday, US Nonfarm Payrolls (NFP) will release, which will provide comprehensive information about the US labor market.
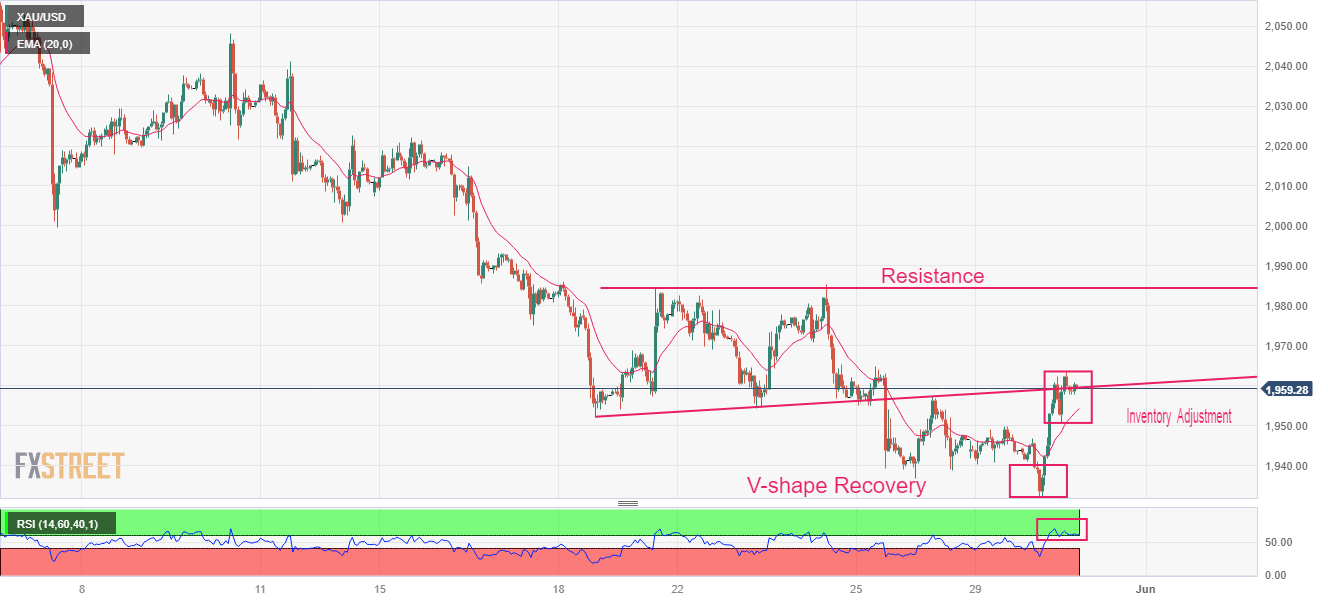
Gold technical analysis
Gold price showed a V-shape recovery after dropping to near $1,932.12 on an hourly scale. The asset is gathering strength for a breakout above the trendline plotted from May 18 low around $1,952.00, which acted as a resistance for the Gold price earlier. Meanwhile, the horizontal resistance is plotted from May 19 high at $1,984.25.
Upward sloping 20-period Exponential Moving Average (EMA) at $1,954.50 indicates that the short-term trend has turned positive.
The Relative Strength Index (RSI) (14) has shifted into the bullish range of 60.00-80.00, which indicates that the upside momentum is active.
Gold hourly chart


© 2000-2026. All rights reserved.
This site is managed by Teletrade D.J. LLC 2351 LLC 2022 (Euro House, Richmond Hill Road, Kingstown, VC0100, St. Vincent and the Grenadines).
The information on this website is for informational purposes only and does not constitute any investment advice.
The company does not serve or provide services to customers who are residents of the US, Canada, Iran, The Democratic People's Republic of Korea, Yemen and FATF blacklisted countries.
Making transactions on financial markets with marginal financial instruments opens up wide possibilities and allows investors who are willing to take risks to earn high profits, carrying a potentially high risk of losses at the same time. Therefore you should responsibly approach the issue of choosing the appropriate investment strategy, taking the available resources into account, before starting trading.
Use of the information: full or partial use of materials from this website must always be referenced to TeleTrade as the source of information. Use of the materials on the Internet must be accompanied by a hyperlink to teletrade.org. Automatic import of materials and information from this website is prohibited.
Please contact our PR department if you have any questions or need assistance at pr@teletrade.global.
transfers