- Analytics
- News and Tools
- Market News
- USD/CAD Price Analysis: A slippage below 1.3650 to activate double top formation
USD/CAD Price Analysis: A slippage below 1.3650 to activate double top formation
- USD/CAD has managed to defend 1.3560 for the time being amid a recovery in the USD Index.
- Canada’s quarterly GDP expanded by 0.8% against 0.4% as estimated and a stagnant performance was reported earlier.
- USD/CAD has formed a Double Top pattern which will be triggered after a confident breakdown of 1.3568.
The USD/CAD pair has managed to defend its downside near 1.3560 in the Tokyo session. The Loonie asset has got some strength propelled by a recovery in the US Dollar Index (DXY). The USD Index has shown a solid recovery after correcting to near 104.13 on hopes that the Federal Reserve (Fed) will push interest rates further in June.
The Canadian Dollar got some strength on Thursday after the release of upbeat Q1 Gross Domestic Product (GDP) numbers. Quarterly GDP expanded by 0.8% against 0.4% as estimated and a stagnant performance was reported in the prior quarter.
While monthly GDP (March) remained stagnant but managed to avoid contraction as expected by the market participants. The content is insufficient to force the Bank of Canada (BoC) to continue hiking interest rates again.
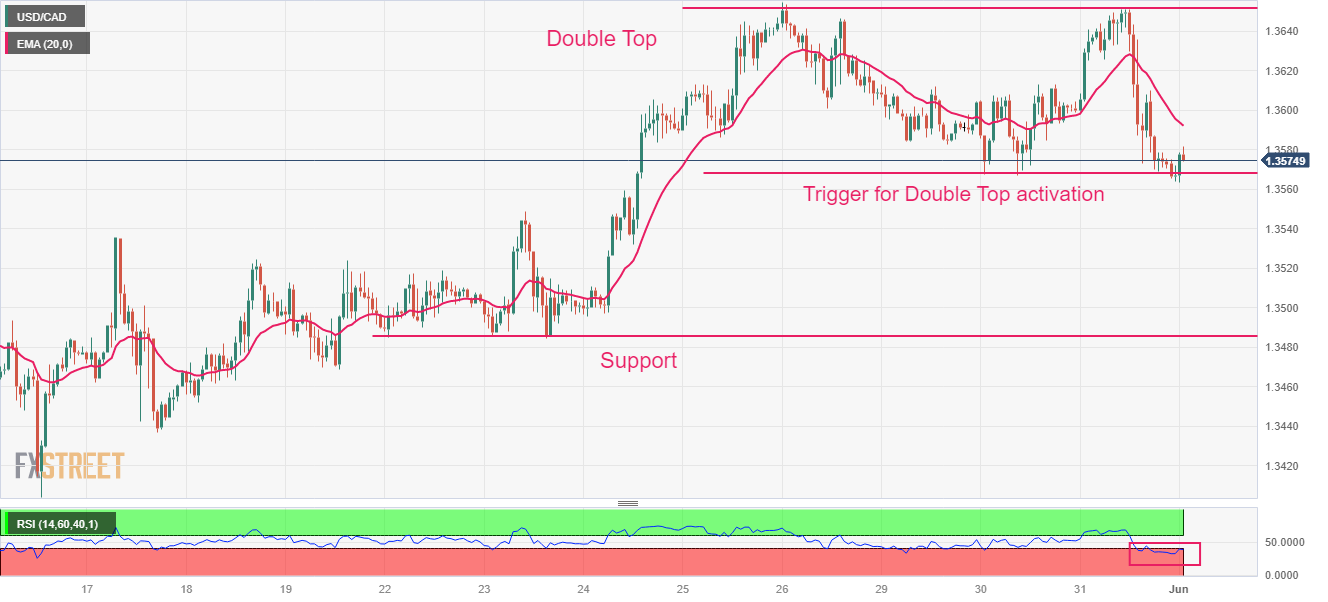
USD/CAD has formed a Double Top chart pattern on an hourly scale, which indicates a bearish reversal due to an absence of buying interest near critical resistance plotted from May 26 high at 1.3665. A confident breakdown of the trigger support around 1.3568 will activate the Double Top formation. Potential support is placed from May 22 low at 1.3485.
Downward-sloping 20-period Exponential Moving Average (EMA) at 1.3592 indicates that the short-term trend is bearish.
Meanwhile, the Relative Strength Index (RSI) (14) is oscillating in the bearish range of 20.00-40.00, which advocates more weakness ahead.
Going forward, a break below the intraday low at 1.3563 will drag the asset toward May 17 high at 1.3536. A breakdown below the latter will expose the Loonie asset to May 22 low at 1.3485.
On the contrary, a fresh buy would come above May 26 high at 1.3655, which would drive the asset toward the round-level resistance at 1.3700 followed by March 27 high at 1.3745.
USD/CAD hourly chart


© 2000-2026. All rights reserved.
This site is managed by Teletrade D.J. LLC 2351 LLC 2022 (Euro House, Richmond Hill Road, Kingstown, VC0100, St. Vincent and the Grenadines).
The information on this website is for informational purposes only and does not constitute any investment advice.
The company does not serve or provide services to customers who are residents of the US, Canada, Iran, The Democratic People's Republic of Korea, Yemen and FATF blacklisted countries.
Making transactions on financial markets with marginal financial instruments opens up wide possibilities and allows investors who are willing to take risks to earn high profits, carrying a potentially high risk of losses at the same time. Therefore you should responsibly approach the issue of choosing the appropriate investment strategy, taking the available resources into account, before starting trading.
Use of the information: full or partial use of materials from this website must always be referenced to TeleTrade as the source of information. Use of the materials on the Internet must be accompanied by a hyperlink to teletrade.org. Automatic import of materials and information from this website is prohibited.
Please contact our PR department if you have any questions or need assistance at pr@teletrade.global.
transfers