- Analytics
- News and Tools
- Market News
- Gold Price Forecast: XAU/USD plays in a $5 range as investors await US NFP for Fed’s interest rate guidance
Gold Price Forecast: XAU/USD plays in a $5 range as investors await US NFP for Fed’s interest rate guidance
- Gold price is consolidating in a narrow range ahead of US Employment data.
- Fears of one more interest rate hike from the Fed are expected to improve the appeal for the USD Index.
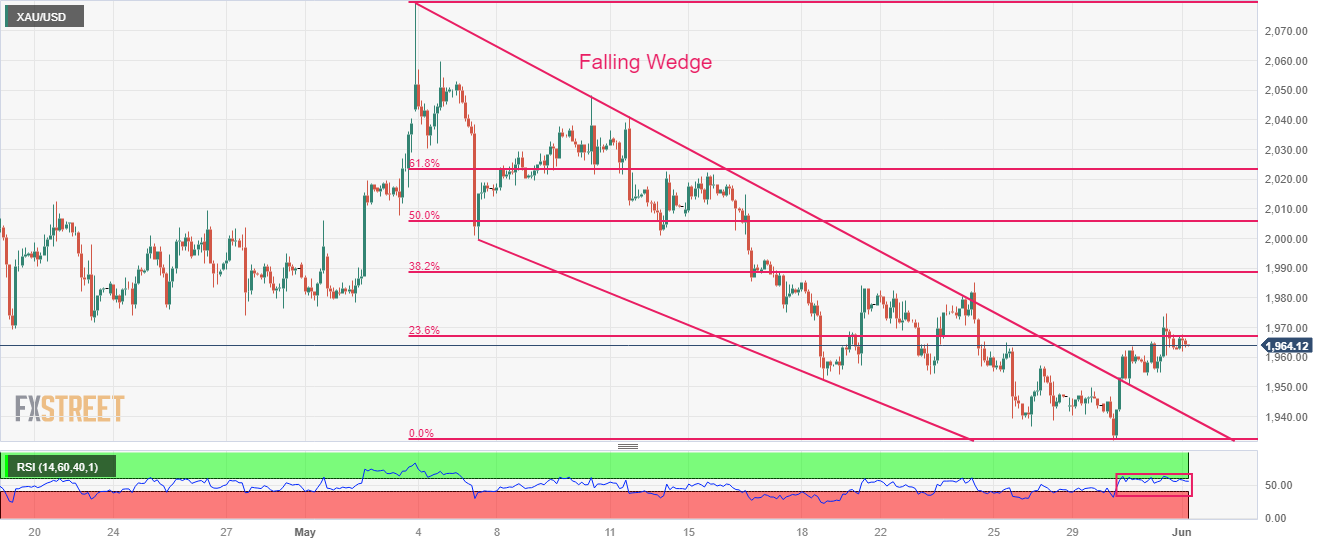
- Gold price is making efforts for breaking above the 23.6% Fibo retracement at $1,967.18.
Gold price (XAU/USD) is demonstrating topsy-turvy moves in a $1,962-1,967 range in the Asian session. The precious metal has turned sideways as investors are awaiting the release of the United States Employment data to gain serious guidance about June’s interest rate policy of the Federal Reserve (Fed).
S&P500 futures are showing choppy moves in Asia after facing selling pressure from investors on Wednesday. The volatility associated with US labor market data weighed on risk-sensitive assets as upbeat numbers would leave no option for the Fed but to raise interest rates further.
The US Dollar Index (DXY) is aiming to extend its recovery above 104.30. Fears of one more interest rate hike from Fed chair Jerome Powell are expected to improve the appeal for the USD Index. After the upbeat US JOLTS Job Openings figure, investors are awaiting US Nonfarm Payrolls (NFP) data to get a clear picture of labor market health.
As per the preliminary report, fresh 190K payrolls were added to the labor market in May, lower than the additions of 253K made in April. The Unemployment Rate is increased to 3.5% vs. the former release of 3.4%. Annual Average Hourly Earnings are seen steady at 4.4% while monthly labor cost is seen expanding by 0.3% at a slower pace than the 0.5% registered in April. This might ease labor cost-push inflation ahead.
Gold technical analysis
Gold price has extended its recovery after delivering a breakout of the Falling Wedge chart pattern formed on a two-hour scale. A breakout of the aforementioned pattern indicates a bullish reversal. The precious metal is making efforts for breaking above the 23.6% Fibonacci retracement (plotted from an all-time high at $2,079.76 to May 30 low at $1,932.12) at $1,967.18.
Also, the Relative Strength Index (RSI) (14) is aiming to shift into the bullish range of 60.00-80.00. An occurrence of the same will activate the upside momentum.
Gold hourly chart


© 2000-2026. All rights reserved.
This site is managed by Teletrade D.J. LLC 2351 LLC 2022 (Euro House, Richmond Hill Road, Kingstown, VC0100, St. Vincent and the Grenadines).
The information on this website is for informational purposes only and does not constitute any investment advice.
The company does not serve or provide services to customers who are residents of the US, Canada, Iran, The Democratic People's Republic of Korea, Yemen and FATF blacklisted countries.
Making transactions on financial markets with marginal financial instruments opens up wide possibilities and allows investors who are willing to take risks to earn high profits, carrying a potentially high risk of losses at the same time. Therefore you should responsibly approach the issue of choosing the appropriate investment strategy, taking the available resources into account, before starting trading.
Use of the information: full or partial use of materials from this website must always be referenced to TeleTrade as the source of information. Use of the materials on the Internet must be accompanied by a hyperlink to teletrade.org. Automatic import of materials and information from this website is prohibited.
Please contact our PR department if you have any questions or need assistance at pr@teletrade.global.
transfers