- Analytics
- News and Tools
- Market News
- Gold Price Forecast: XAU/USD drops sharply below $1,960 as USD Index extends recovery
Gold Price Forecast: XAU/USD drops sharply below $1,960 as USD Index extends recovery
- Gold price has attempted a downside break of the consolidation formed above $1,960.00 amid a recovery in the USD Index.
- The expectations of a temporary pause in the policy-tightening spell by the Fed have soared due to weak US Services PMI.
- Gold price is consolidating in a range of $1,932-1,985 for the past three weeks.
Gold price (XAU/USD) has displayed a sharp drop to near $1,960.00 in the European session. The precious metal is trying to come out of the woods. A minor sell-off in the Gold price has been propelled by a recovery extension in the US Dollar Index (DXY).
S&P500 futures have carry-forwarded nominal gains added in Asia to the London session. The market mood is quite cheerful as investors are anticipating that the Federal Reserve (Fed) is going to consider a neutral interest rate policy stance thoroughly for June’s monetary policy.
The expectations of a temporary pause in the policy-tightening spell by the Fed have soared after the United States Services PMI, reported by the ISM agency, hardly managed to dodge contraction. The economic data was marginally above the 50.0 threshold. Subdued service sector and contracting factory activities are pushing the United States economy aggressively toward a recession.
The US Dollar Index has rebounded to near 104.25 despite the street is anticipating that divergence in Fed’s interest rate policy with other global central banks will drop as the former is likely to keep rates steady while others are preparing for a fresh interest rate hike. The yields offered on 10-year US government bonds have also rebounded marginally above 3.66%.
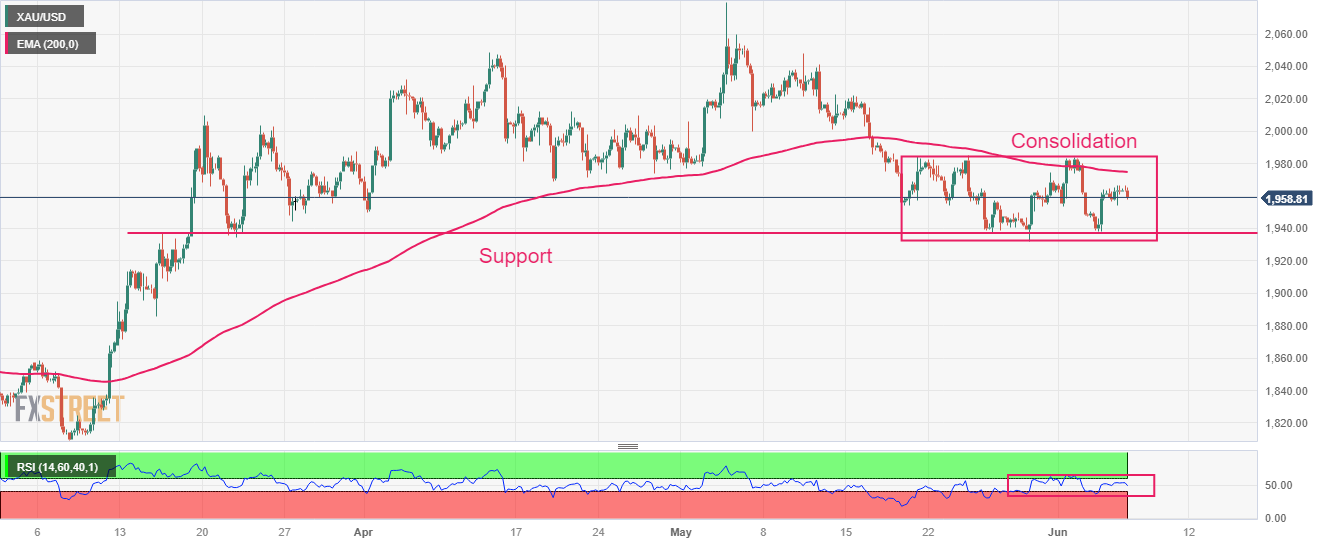
Gold technical analysis
Gold price is consolidating in a range of $1,932-1,985 for the past three weeks on a four-hour. The precious metal is struggling in delivering a decisive move amid an absence of a potential trigger. Broadly, horizontal support is plotted from March 15 high at $1,937.39. The magical 200-period Exponential Moving Average (EMA) at $1,975.47 is acting as a strong barrier for the Gold bulls.
An oscillation in the 40.00-60.00 territory by the Relative Strength Index (RSI) (14) indicates a non-directional performance.
Gold four-hour chart


© 2000-2026. All rights reserved.
This site is managed by Teletrade D.J. LLC 2351 LLC 2022 (Euro House, Richmond Hill Road, Kingstown, VC0100, St. Vincent and the Grenadines).
The information on this website is for informational purposes only and does not constitute any investment advice.
The company does not serve or provide services to customers who are residents of the US, Canada, Iran, The Democratic People's Republic of Korea, Yemen and FATF blacklisted countries.
Making transactions on financial markets with marginal financial instruments opens up wide possibilities and allows investors who are willing to take risks to earn high profits, carrying a potentially high risk of losses at the same time. Therefore you should responsibly approach the issue of choosing the appropriate investment strategy, taking the available resources into account, before starting trading.
Use of the information: full or partial use of materials from this website must always be referenced to TeleTrade as the source of information. Use of the materials on the Internet must be accompanied by a hyperlink to teletrade.org. Automatic import of materials and information from this website is prohibited.
Please contact our PR department if you have any questions or need assistance at pr@teletrade.global.
transfers