- Analytics
- News and Tools
- Market News
- USD/JPY Price Analysis: Climbs back to 142.00 mark, seems poised to appreciate further
USD/JPY Price Analysis: Climbs back to 142.00 mark, seems poised to appreciate further
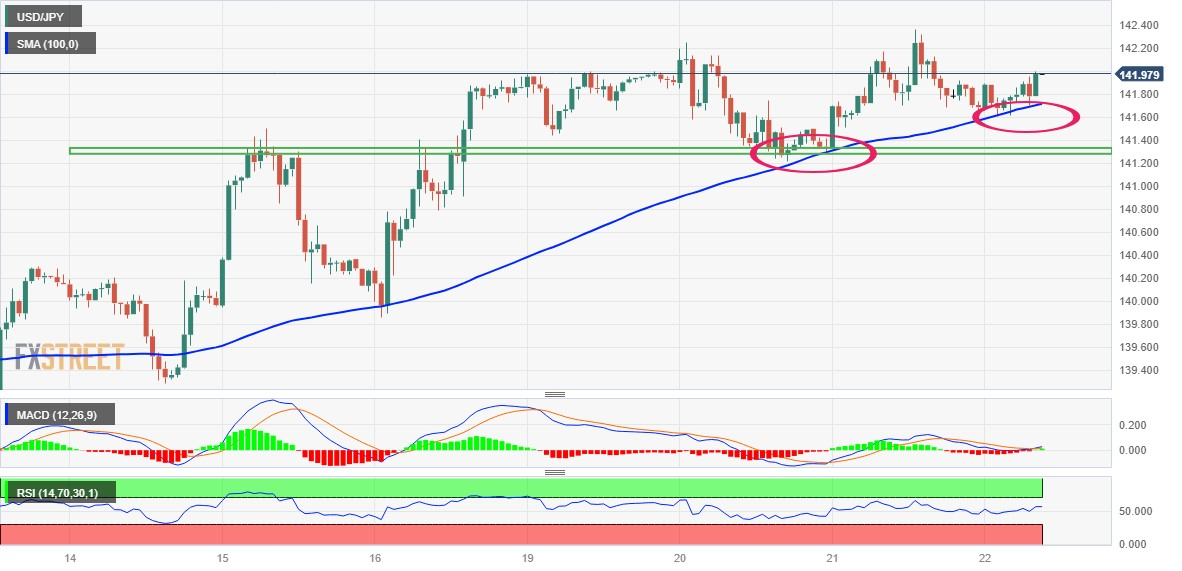
- USD/JPY attracts some buying near the 100-hour SMA for the second straight day on Thursday.
- The price action favours bullish traders and supports prospects for a further appreciating move.
- A sustained break below the weekly trading range support is needed to negate the positive bias.
The USD/JPY pair finds support near the 100-hour Simple Moving Average (SMA) for the second straight day on Thursday and climbs back to the 142.00 neighbourhood during the early European session. Spot prices, however, remain below the YTD peak touched on Wednesday and well within a familiar trading range held since the beginning of the current week.
Against the backdrop of the recent appreciating move witnessed over the past two weeks or so, the rang-bound price action might still be categorized as a bullish consolidation phase. Furthermore, last week's sustained breakout through a horizontal resistance near the 141.00 mark supports prospects for additional gains. That said, the Relative Strength Index (RSI) on the daily chart is hovering just below the overbought territory and holding back traders from placing fresh bullish bets around the USD/JPY pair.
Nevertheless, spot prices remain on track to build on over a one-month-old uptrend and climb further beyond the 142.35 area, or the highest level since November 2022 touched on Wednesday, towards reclaiming the 143.00 round figure. The upward trajectory could get extended further towards the next relevant hurdle near the 143.75 region en route to the 144.00 mark. The USD/JPY pair might eventually climb to the 144.30-144.35 intermediate hurdle, above which bulls might aim to reclaim the 145.00 psychological mark.
On the flip side, the 100-hour SMA, currently around the 141.670-141.65 area, now seems to protect the immediate downside ahead of the 141.30-141.20 area, or the weekly low. A convincing break below the latter might prompt some technical selling and drag the USD/JPY pair below the 141.00 mark, towards the 140.60-140.55 horizontal support. Any subsequent decline might attract fresh buyers near the 140.25 zone and remain limited near the 140.00 psychological mark. The latter should act as a strong base for spot prices, which if broken might shift the bias in favour of bearish traders.
USD/JPY 1-hour chart
Key levels to watch


© 2000-2026. All rights reserved.
This site is managed by Teletrade D.J. LLC 2351 LLC 2022 (Euro House, Richmond Hill Road, Kingstown, VC0100, St. Vincent and the Grenadines).
The information on this website is for informational purposes only and does not constitute any investment advice.
The company does not serve or provide services to customers who are residents of the US, Canada, Iran, The Democratic People's Republic of Korea, Yemen and FATF blacklisted countries.
Making transactions on financial markets with marginal financial instruments opens up wide possibilities and allows investors who are willing to take risks to earn high profits, carrying a potentially high risk of losses at the same time. Therefore you should responsibly approach the issue of choosing the appropriate investment strategy, taking the available resources into account, before starting trading.
Use of the information: full or partial use of materials from this website must always be referenced to TeleTrade as the source of information. Use of the materials on the Internet must be accompanied by a hyperlink to teletrade.org. Automatic import of materials and information from this website is prohibited.
Please contact our PR department if you have any questions or need assistance at pr@teletrade.global.
transfers