- Analytics
- News and Tools
- Market News
- Silver Price Analysis: XAG/USD corrects further from over two-month top, bullish bias remains
Silver Price Analysis: XAG/USD corrects further from over two-month top, bullish bias remains
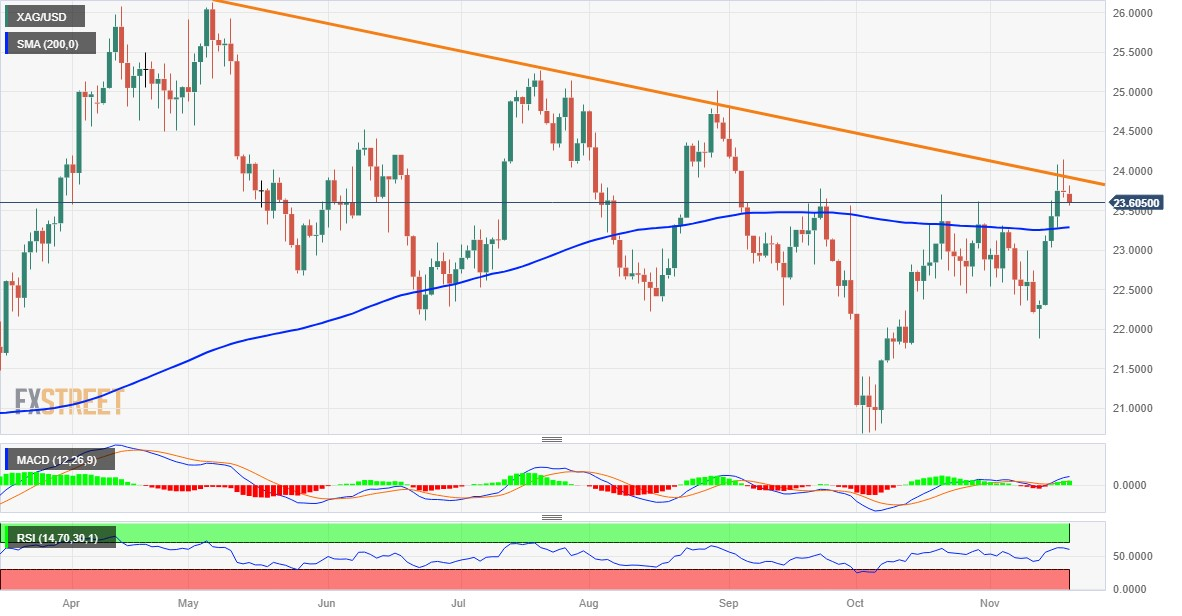
- Silver edges lower and retreat further from over a two-month peak touched on Friday.
- The technical setup supports prospects for the emergence of dip-buying at lower levels.
- A sustained move beyond a descending trend line is needed to reaffirm the positive bias.
Silver (XAG/USD) extends Friday's retracement slide from the $24.15 region, or its highest level since September 4 and remains under some selling pressure on the first day of a new week. The white metal remains depressed through the early part of the European session and currently trades around the $23.65-$23.60 area, down nearly 0.50% for the day.
From a technical perspective, last week's breakout momentum through the very important 200-day Simple Moving Average (SMA) falters near a resistance marked by a downward sloping trend line extending from the May monthly swing high. The said barrier, currently around the $24.00 round figure, should now act as a key pivotal point for the XAG/USD and help determine the next leg of a directional move.
Oscillators on the daily chart, meanwhile, are holding in the positive territory and are still far from being in the overbought zone. This, in turn, suggests that the path of least resistance for the XAG/USD is to the upside and supports prospects for the emergence of some dip-buying at lower levels. Bulls, however, need to wait for acceptance above the $24.00 mark before placing fresh bets and positioning for further gains.
The XAG/USD might then aim to surpass the $24.20-$24.25 intermediate resistance and make a fresh attempt to conquer the $25.00 psychological mark. Some follow-through buying beyond the $25.15-$25.20 region should set the stage for a more towards reclaiming the $26.00 round figure for the first time since May.
On the flip side, the 200-day SMA, currently pegged near the $23.30 region, now seems to protect the immediate downside. Any further decline could be seen as a buying opportunity and remain limited near the $23.00 mark. That said, a convincing break below the latter might prompt aggressive technical selling and drag the XAG/USD further towards the $22.35-$22.30 zone en route to the $22.00 mark.
Silver daily chart
Technical levels to watch


© 2000-2026. All rights reserved.
This site is managed by Teletrade D.J. LLC 2351 LLC 2022 (Euro House, Richmond Hill Road, Kingstown, VC0100, St. Vincent and the Grenadines).
The information on this website is for informational purposes only and does not constitute any investment advice.
The company does not serve or provide services to customers who are residents of the US, Canada, Iran, The Democratic People's Republic of Korea, Yemen and FATF blacklisted countries.
Making transactions on financial markets with marginal financial instruments opens up wide possibilities and allows investors who are willing to take risks to earn high profits, carrying a potentially high risk of losses at the same time. Therefore you should responsibly approach the issue of choosing the appropriate investment strategy, taking the available resources into account, before starting trading.
Use of the information: full or partial use of materials from this website must always be referenced to TeleTrade as the source of information. Use of the materials on the Internet must be accompanied by a hyperlink to teletrade.org. Automatic import of materials and information from this website is prohibited.
Please contact our PR department if you have any questions or need assistance at pr@teletrade.global.
transfers