- Analytics
- News and Tools
- Market News
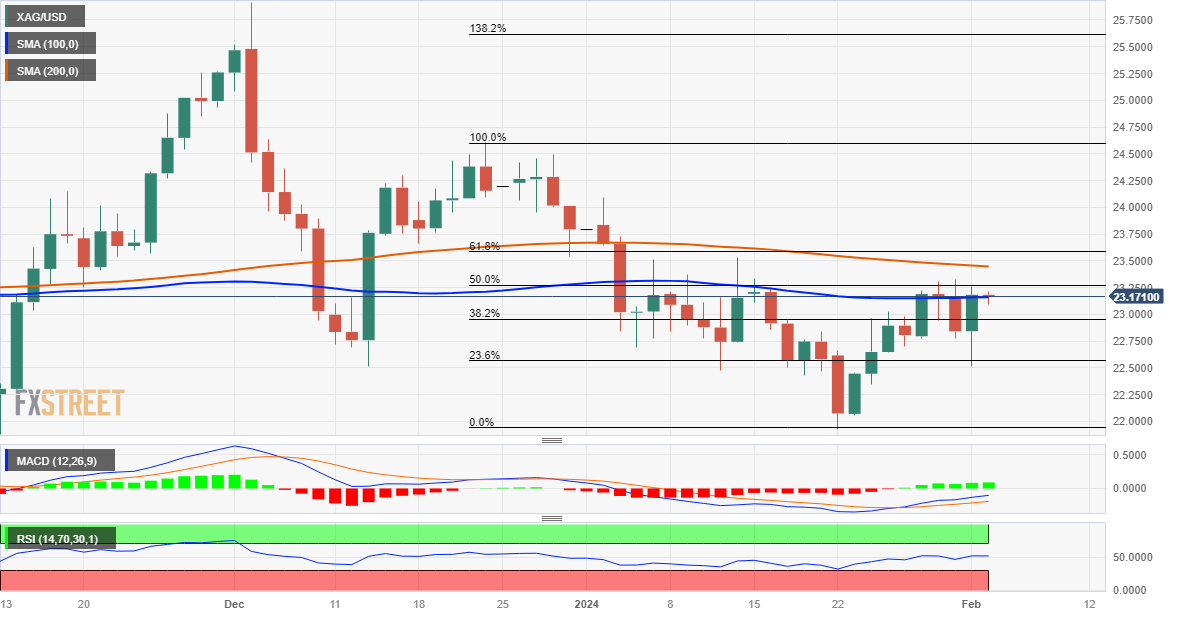
- Silver Price Analysis: XAG/USD consolidates around 100-day SMA, below 50% Fibo.
Silver Price Analysis: XAG/USD consolidates around 100-day SMA, below 50% Fibo.
- Silver oscillates in a narrow trading band just below the 50% Fibo. level on Friday.
- The technical setup favours bullish trades and supports prospects for further gains.
- A convincing break below the $22.55 area is needed to negate the positive outlook.
Silver (XAG/USD) struggles to capitalize on the previous day's solid recovery from the $22.50 region, or a one-week trough and oscillates in a narrow trading band through the first half of the European session on Friday. The white metal currently trades around the $23.15 region, nearly unchanged for the day, as traders keenly await the release of the US monthly jobs report (NFP) before placing fresh directional bets.
From a technical perspective, the XAG/USD, so far, has been struggling to break through a resistance marked by the 50% Fibonacci retracement level of the late December-January downfall. This is closely followed by the very important 200-day Simple Moving Average (SMA), currently around the $23.45 region, and the 61.8% Fibo. level near the $23.55 area. A sustained strength beyond the latter will be seen as a fresh trigger for bullish traders and set the stage for an extension of the recent move up from sub-$22.00 levels, or over a two-month low touched on January 22.
Given that oscillators on the daily chart have just started gaining positive traction, the XAG/USD might then aim back towards reclaiming the $24.00 round figure. The momentum could extend towards the next relevant hurdle near the $24.50-$24.60 area and the $25.00 psychological mark. Some follow-through buying has the potential to lift the white metal to the $25.45-$25.50 intermediate barrier en route to the $26.00 neighbourhood, or the December swing high.
On the flip side, weakness back below the $23.00 mark might continue to find some support near the $22.55 area, which if broken decisively will suggest that a nearly two-week-old uptrend has run its course and shift the bias back in favour of bearish traders. The XAG/USD might then turn vulnerable to retest the $21.95-$21.90 region, or a two-month low, before eventually dropping to the $21.40-$21.35 area en route to the $21.00 mark and the $20.70-$20.65 zone, or the October swing low.
Silver daily chart
Technical levels to watch


© 2000-2026. All rights reserved.
This site is managed by Teletrade D.J. LLC 2351 LLC 2022 (Euro House, Richmond Hill Road, Kingstown, VC0100, St. Vincent and the Grenadines).
The information on this website is for informational purposes only and does not constitute any investment advice.
The company does not serve or provide services to customers who are residents of the US, Canada, Iran, The Democratic People's Republic of Korea, Yemen and FATF blacklisted countries.
Making transactions on financial markets with marginal financial instruments opens up wide possibilities and allows investors who are willing to take risks to earn high profits, carrying a potentially high risk of losses at the same time. Therefore you should responsibly approach the issue of choosing the appropriate investment strategy, taking the available resources into account, before starting trading.
Use of the information: full or partial use of materials from this website must always be referenced to TeleTrade as the source of information. Use of the materials on the Internet must be accompanied by a hyperlink to teletrade.org. Automatic import of materials and information from this website is prohibited.
Please contact our PR department if you have any questions or need assistance at pr@teletrade.global.
transfers