- Analytics
- News and Tools
- Market News
- EUR/GBP threatens the 20-day SMA after European PMIs
EUR/GBP threatens the 20-day SMA after European PMIs
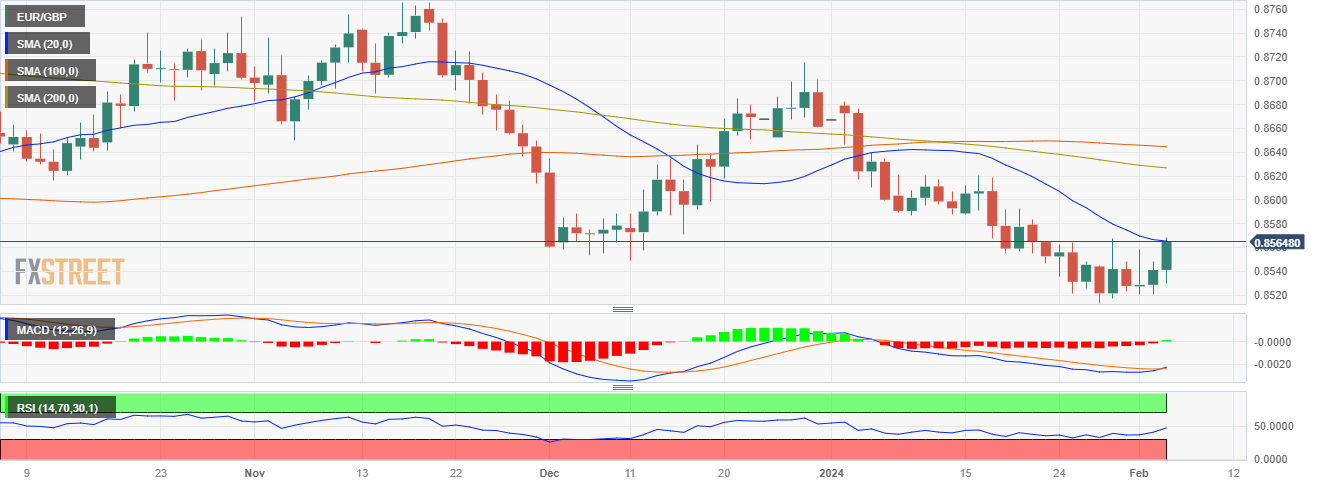
- The EUR/GBP stands at 0.8560, marking a 0.25% increase in the session.
- European PMIs from January where upwards revised but remained still in contraction territory.
- Hourly indicators hint at potential consolidation after bulls got rejected near overbought area.
In Monday's session, the EUR/GBP pair was seen trading at 0.8560, gaining a 0.25% and seems to be marching towards the 20-day Simple Moving Average (SMA) at 0.8565 . Despite pressures from a stagnant Euro Area economy and anticipations of ECB's rate cut, the daily chart indicates the dominance of buyers. On the hourly chart, however, indicators hint at a possible pullback as they got rejected near the overbought territory.
During the European session, the Hamburg Commercial Bank (HCOB) PMIs from January where upwards revised which gave some traction to the EUR but they still remain deep in contraction area. This situation may push the ECB to initiate a rate cut by June 2024, assuming the economies continue to weaken. Conversely, the UK economy shows signs of potential firmness with the Bank of England (BoE) shifting from assessing the need for restrictive monetary policy to sustaining the current stance. Following the bank's decision to hold rates, market anticipates around 100 bps of rate cuts for 2024, which might be moderated due to expected fiscal amendments. On the ECB side, markets expect between 125 and 150 bps of easing in 2024 and this divergences may eventually limit any upwards movements by the cross.
EUR/GBP levels to watch
Assessing the daily chart indicators, the Relative Strength Index (RSI) is glimpsing a positive gradient despite being within negative territory. This exhibits a potential shift towards an upward trend as bulls start to conquer additional ground. In addition, the Moving Average Convergence Divergence (MACD) is exhibiting increased green bars, suggesting that the upward force is taking control. The shift in momentum may come into fruition in case the buyers manage to push the pair back above the 20-day Simple Moving Average (SMA) .
Switching to the hourly chart for the more immediate perspective, the scenario seems to be a bit more complicated for the bulls. Even though indicators have been rebuffed near overbought territory, the RSI portrays a downward slope positioned within positive territory, indicating some selling momentum as buyers seem to be taking profits. However, the sustained growth in the green bars of the MACD identifies a continuous buying pressure in the shorter timeframe.
EUR/GBP daily chart


© 2000-2026. All rights reserved.
This site is managed by Teletrade D.J. LLC 2351 LLC 2022 (Euro House, Richmond Hill Road, Kingstown, VC0100, St. Vincent and the Grenadines).
The information on this website is for informational purposes only and does not constitute any investment advice.
The company does not serve or provide services to customers who are residents of the US, Canada, Iran, The Democratic People's Republic of Korea, Yemen and FATF blacklisted countries.
Making transactions on financial markets with marginal financial instruments opens up wide possibilities and allows investors who are willing to take risks to earn high profits, carrying a potentially high risk of losses at the same time. Therefore you should responsibly approach the issue of choosing the appropriate investment strategy, taking the available resources into account, before starting trading.
Use of the information: full or partial use of materials from this website must always be referenced to TeleTrade as the source of information. Use of the materials on the Internet must be accompanied by a hyperlink to teletrade.org. Automatic import of materials and information from this website is prohibited.
Please contact our PR department if you have any questions or need assistance at pr@teletrade.global.
transfers