- Analytics
- News and Tools
- Market News
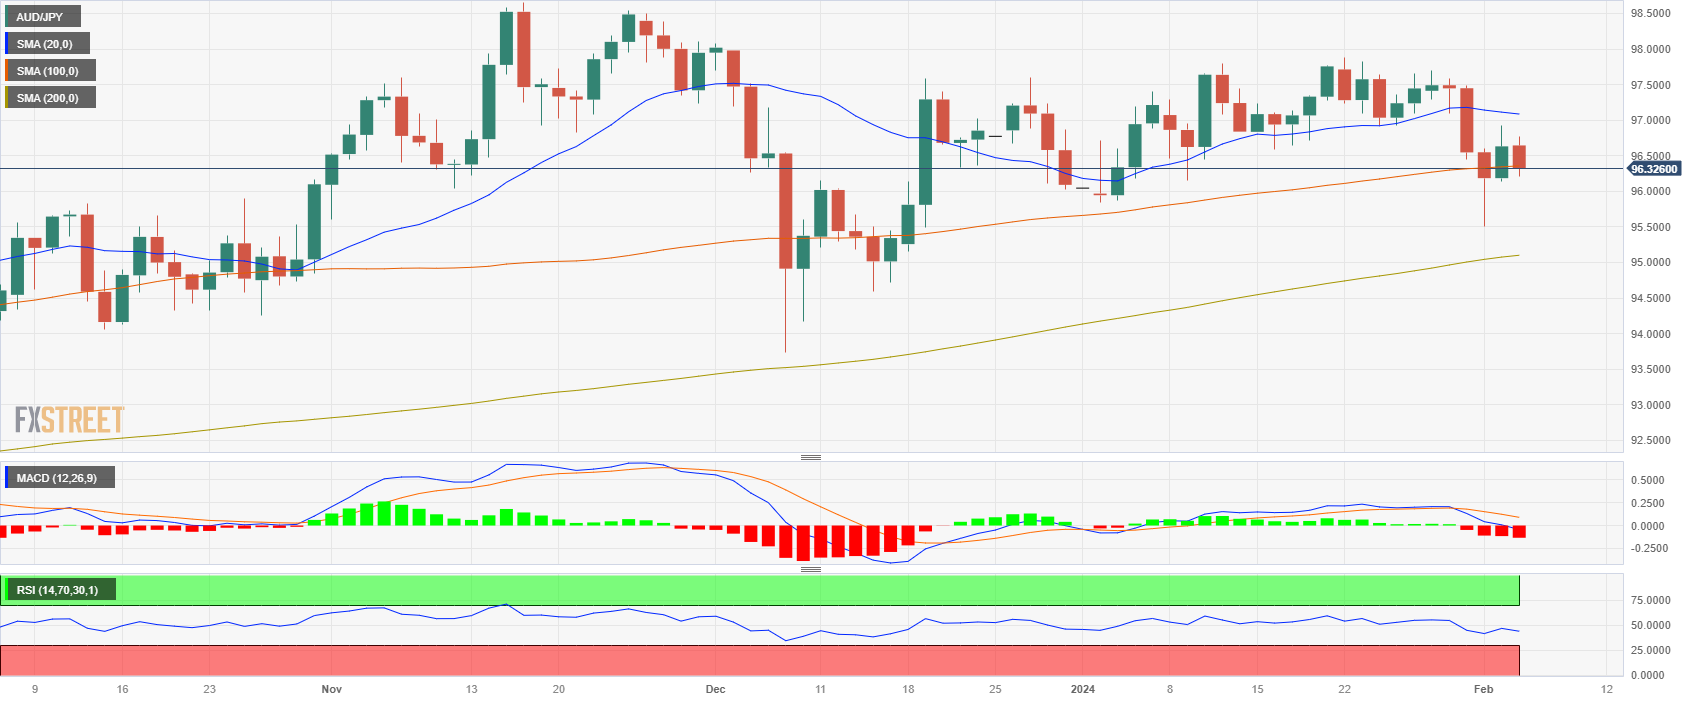
- AUD/JPY price analysis: Bulls hold the line and defend the 100-day SMA
AUD/JPY price analysis: Bulls hold the line and defend the 100-day SMA
- The AUD/JPY is currently trading at 96.32, recording a loss of 0.30%.
- According to daily chart indicators, negative RSI trajectory and ascending red MACD histogram hint bearish momentum.
- Hourly chart indicators imply bearish pressure has eased with a rebound in bulls evident in positive RSI slope and flat MACD bars.
In Monday's session, the AUD/JPY pair lost ground, with a low of 96.32 following a previous high of 96.80 earlier in the day. On the fundamental side, markets await the Reserve Bank of Australia meeting on Tuesday where investors will look for clues for forward guidance which could set the pace of the cross for the week. The technical outlook for the pair remains neutral to bearish on the daily chart, although recent activity shows the bulls regaining some ground on the hourly chart.
AUD/JPY levels to watch
According to the daily chart, it is showing a neutral to bearish outlook. The negative territory and declining slope of the Relative Strength Index (RSI) indicates a bearish momentum. Simultaneously, the Moving Average Convergence Divergence (MACD) histogram showcases increasing sake of red bars which signals the short-term downward pressure. Nevertheless, despite the shorter-term momentum suggesting bearish sentiment, when looking at the Simple Moving Averages (SMAs), the pair is evidently below the 20-day SMA but bulls are presenting battle at the 100-day SMA and is still above the 200-day average. This indicates that in the larger picture, bulls maintain a stronghold.
Moving onto the shorter-term outlook given by the hourly chart, it presents a slightly different picture. On this timeframe, despite the bears taking a step back and allowing for some recovery, the bullish force is merely reflected as a retaliation rather than a comeback. The Relative Strength Index (RSI) although in negative territory, boasts a positive slope indicative of some bullish pushback. The Moving Average Convergence Divergence (MACD) echoes this sentiment with flat red bars. However, the buying momentum is not sufficient to negate the dominant selling sentiment, but it does put forth a pause in the bearish outlook of the session.


© 2000-2026. All rights reserved.
This site is managed by Teletrade D.J. LLC 2351 LLC 2022 (Euro House, Richmond Hill Road, Kingstown, VC0100, St. Vincent and the Grenadines).
The information on this website is for informational purposes only and does not constitute any investment advice.
The company does not serve or provide services to customers who are residents of the US, Canada, Iran, The Democratic People's Republic of Korea, Yemen and FATF blacklisted countries.
Making transactions on financial markets with marginal financial instruments opens up wide possibilities and allows investors who are willing to take risks to earn high profits, carrying a potentially high risk of losses at the same time. Therefore you should responsibly approach the issue of choosing the appropriate investment strategy, taking the available resources into account, before starting trading.
Use of the information: full or partial use of materials from this website must always be referenced to TeleTrade as the source of information. Use of the materials on the Internet must be accompanied by a hyperlink to teletrade.org. Automatic import of materials and information from this website is prohibited.
Please contact our PR department if you have any questions or need assistance at pr@teletrade.global.
transfers