- Analytics
- News and Tools
- Market News
- NZD/JPY Price Analysis: Bears intensify their grip, bulls must defend SMAs
NZD/JPY Price Analysis: Bears intensify their grip, bulls must defend SMAs
- The NZD/JPY gave up daily gains and trades with losses in the American Session.
- The hourly chart, shows indicators moving towards oversold terrain.
- On the daily chart, indicators stand mostly flat.
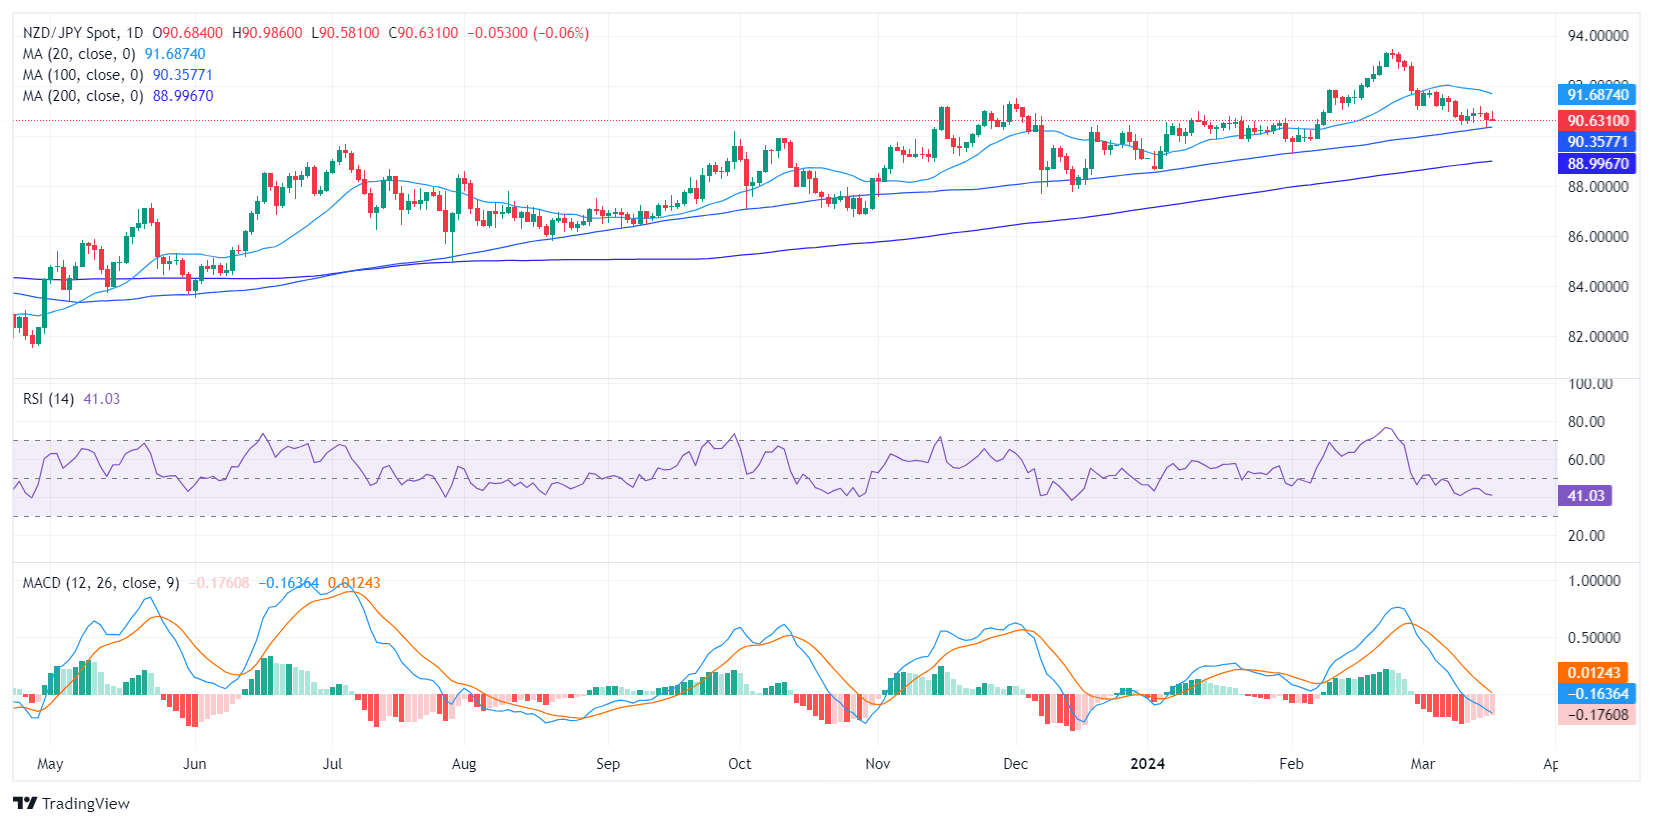
In Monday's trading, the NZD/JPY reversed its course and gave up daily gains to decline towards 90.60. Recent movements show an intensification of seller activity as indicators slowly move towards oversold territory while on the daily chart the selling traction somewhat flattened.
On the daily chart, the Relative Strength Index (RSI) fell last week within negative territory and currently stands at around 40.65, mostly flat. This reveals lower momentum from the sellers. This tendency is exalted with the Moving Average Convergence Divergence (MACD) 's flat red bars suggest that negative momentum is consolidating.
NZD/JPY daily chart
Turning attention to the hourly chart, the RSI fell deeper into negative territory while the MACD exhibited rising red bars. However, as short-term indicators seem to be moving towards oversold territory, it could pave the way for a short-term recovery to consolidate losses.
NZD/JPY hourly chart
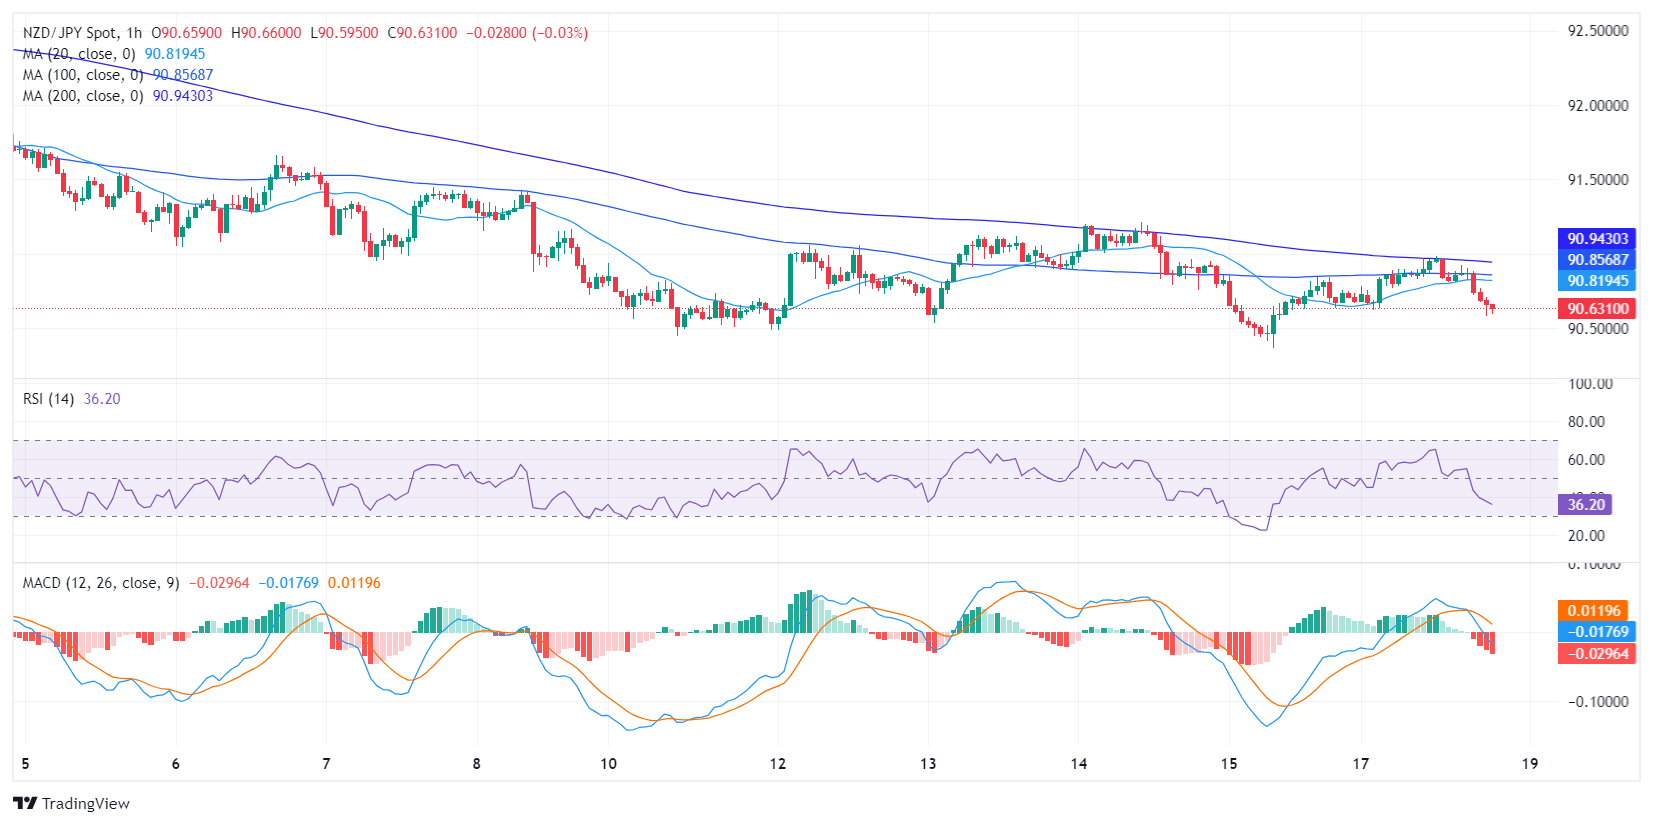
In conclusion, while indicators appear to have turned flat on the daily chart, the selling momentum intensified in the hourly chart, suggesting that the pair could suffer more pain for the rest of the session. Looking at the broader trend, there are not enough arguments to conclude a bearish outlook as the pair sits above the 100 and 200-day Simple Moving Average (SMA). That being said, the sellers are in control for the immediate short term.


© 2000-2026. All rights reserved.
This site is managed by Teletrade D.J. LLC 2351 LLC 2022 (Euro House, Richmond Hill Road, Kingstown, VC0100, St. Vincent and the Grenadines).
The information on this website is for informational purposes only and does not constitute any investment advice.
The company does not serve or provide services to customers who are residents of the US, Canada, Iran, The Democratic People's Republic of Korea, Yemen and FATF blacklisted countries.
Making transactions on financial markets with marginal financial instruments opens up wide possibilities and allows investors who are willing to take risks to earn high profits, carrying a potentially high risk of losses at the same time. Therefore you should responsibly approach the issue of choosing the appropriate investment strategy, taking the available resources into account, before starting trading.
Use of the information: full or partial use of materials from this website must always be referenced to TeleTrade as the source of information. Use of the materials on the Internet must be accompanied by a hyperlink to teletrade.org. Automatic import of materials and information from this website is prohibited.
Please contact our PR department if you have any questions or need assistance at pr@teletrade.global.
transfers