- Analytics
- News and Tools
- Market News
- Silver Price Analysis: XAG/USD finds some light ahead of Fed meeting
Silver Price Analysis: XAG/USD finds some light ahead of Fed meeting
- The XAG/USD stands firm near $24.90 in Wednesday's session.
- US Treasury yields are mixed with some rising and others declining.
- Jerome Powell's presser and the updated Dot Plots may fuel volatility in the bond market.
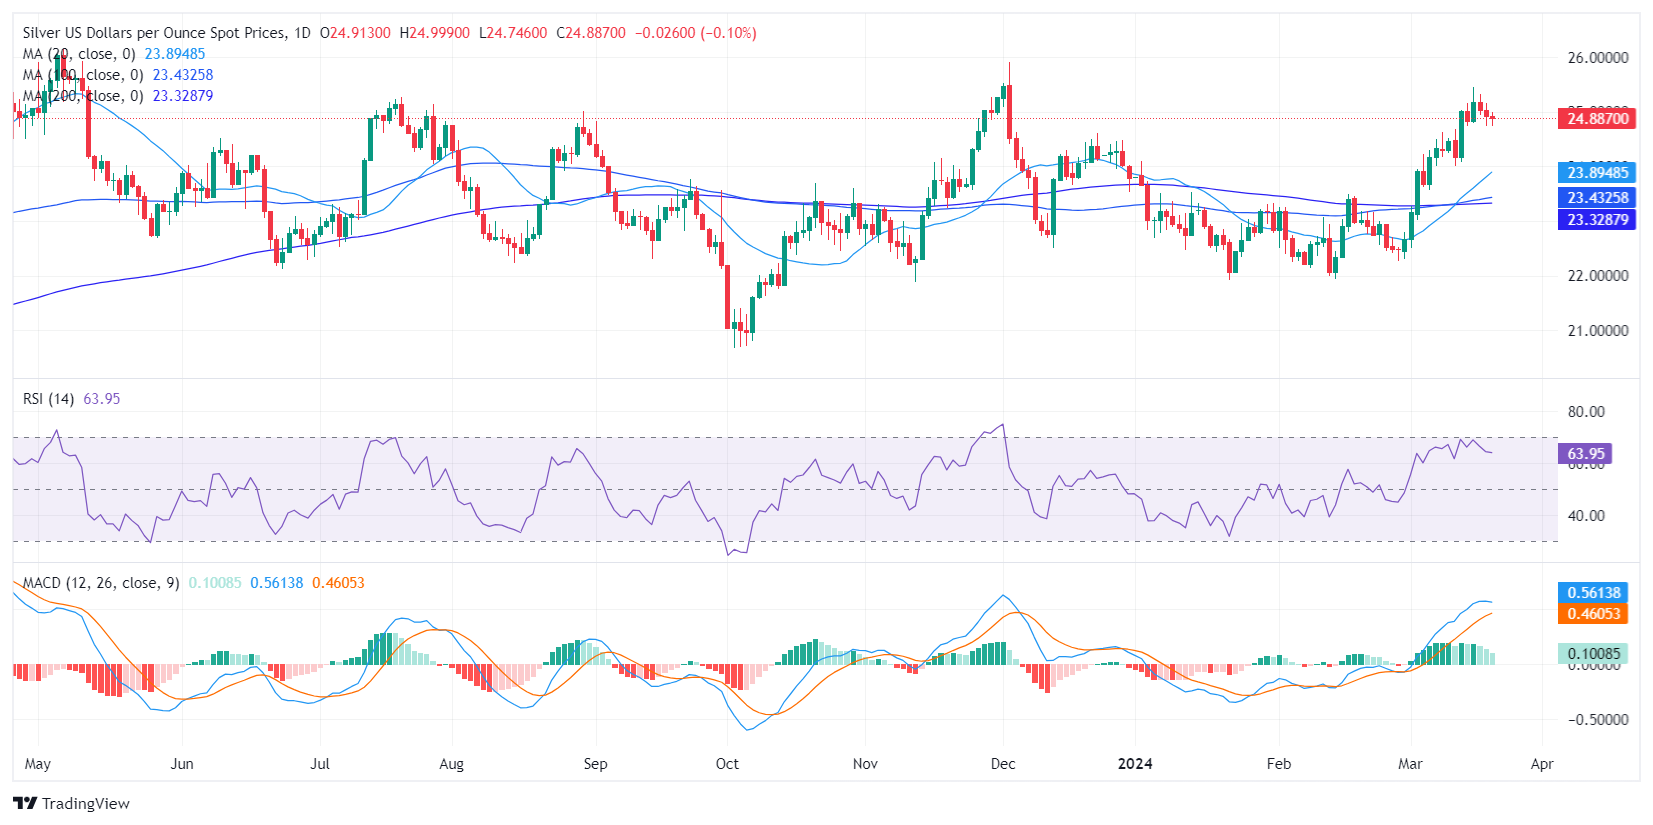
In Wednesday's session, the XAG/USD traded at $24.90, marking a 0.20% increase. While investors await the Federal Reserve (Fed) decision, the US Treasury bond yields, often seen as the cost of holding non-yielding metals, remain calm but could face aggressive movements if the bank delivers a dovish or hawkish surprise.
Markets will closely look at the updated Dot Plots and see if the Fed officials still see 100 bps of easing in 2024. As for now, Jerome Powell was seen somewhat dovish in his testimony before Congress while the Fed officials remained cautious. Meanwhile, the odds of a cut in May remain low while the doves continue to bet on the easing cycle to kick off in June.
XAG/USD technical analysis
Based on the indicators of the daily chart, the Relative Strength Index (RSI) for the XAG/USD pair leans positive, predominantly displaying values in the 60s range. This reveals a dominance of buyers in the market, deepening the positive terrain. Combined with the decreasing green bars of the Moving Average Convergence Divergence (MACD) histogram, momentum seems to shift towards a slight downturn. Still, the bullish phase with moderate volatility is maintained.
From a Simple Moving Average (SMA) analysis perspective, the pair is above the 20, 100, and 200-day SMAs, suggesting that the bulls have firm control in the overall trend.
XAG/USD daily chart


© 2000-2026. All rights reserved.
This site is managed by Teletrade D.J. LLC 2351 LLC 2022 (Euro House, Richmond Hill Road, Kingstown, VC0100, St. Vincent and the Grenadines).
The information on this website is for informational purposes only and does not constitute any investment advice.
The company does not serve or provide services to customers who are residents of the US, Canada, Iran, The Democratic People's Republic of Korea, Yemen and FATF blacklisted countries.
Making transactions on financial markets with marginal financial instruments opens up wide possibilities and allows investors who are willing to take risks to earn high profits, carrying a potentially high risk of losses at the same time. Therefore you should responsibly approach the issue of choosing the appropriate investment strategy, taking the available resources into account, before starting trading.
Use of the information: full or partial use of materials from this website must always be referenced to TeleTrade as the source of information. Use of the materials on the Internet must be accompanied by a hyperlink to teletrade.org. Automatic import of materials and information from this website is prohibited.
Please contact our PR department if you have any questions or need assistance at pr@teletrade.global.
transfers