- Analytics
- News and Tools
- Market News
- EUR/JPY Price Analysis: Bearish short-term trend surfaces, bullish outlook holds for broader timeframe
EUR/JPY Price Analysis: Bearish short-term trend surfaces, bullish outlook holds for broader timeframe
- Even though daily chart indicators reveal weakening momentum, the overall trend remains positive.
- In the hourly chart, the RSI deep in the negative area implies sellers are in charge during the day's trading.
- To maintain momentum, the bulls need to defend the 20-day SMA.
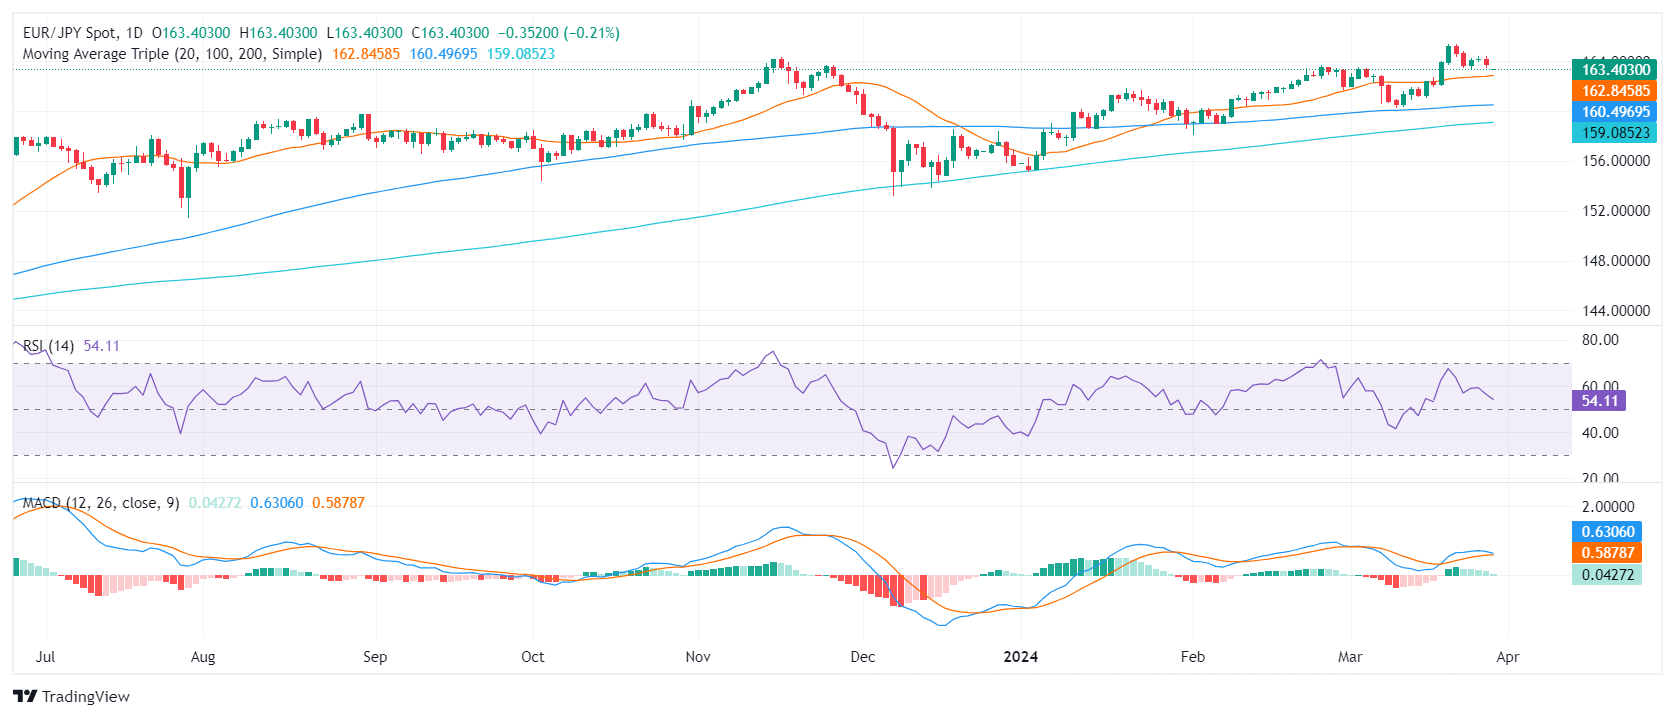
In Thursday's session, the EUR/JPY pair is trading at around 163.40, experiencing a minor loss. The broader perspective leans in favor of the bulls, indicating buying strength that keeps the pair above its 20, 100, and 200-day Simple Moving Averages (SMAs). Despite this, there is evidence of mounting selling pressure on the daily chart.
On the daily chart, the Relative Strength Index (RSI) descended from nearing overbought conditions last week towards 54. The MACD histogram also indicates that buyer momentum might be waning, as inferred from the flat green bars. These market indicators suggest potential near-term volatility in the pair's direction.
EUR/JPY daily chart
Transitioning to the hourly chart, RSI readings convey a more negative sentiment. The latest value stands at 44, signaling sellers as dominant in the short-term movements. The MACD histogram, however, prints green bars which adds neutrality to the intraday outlook.
EUR/JPY hourly chart
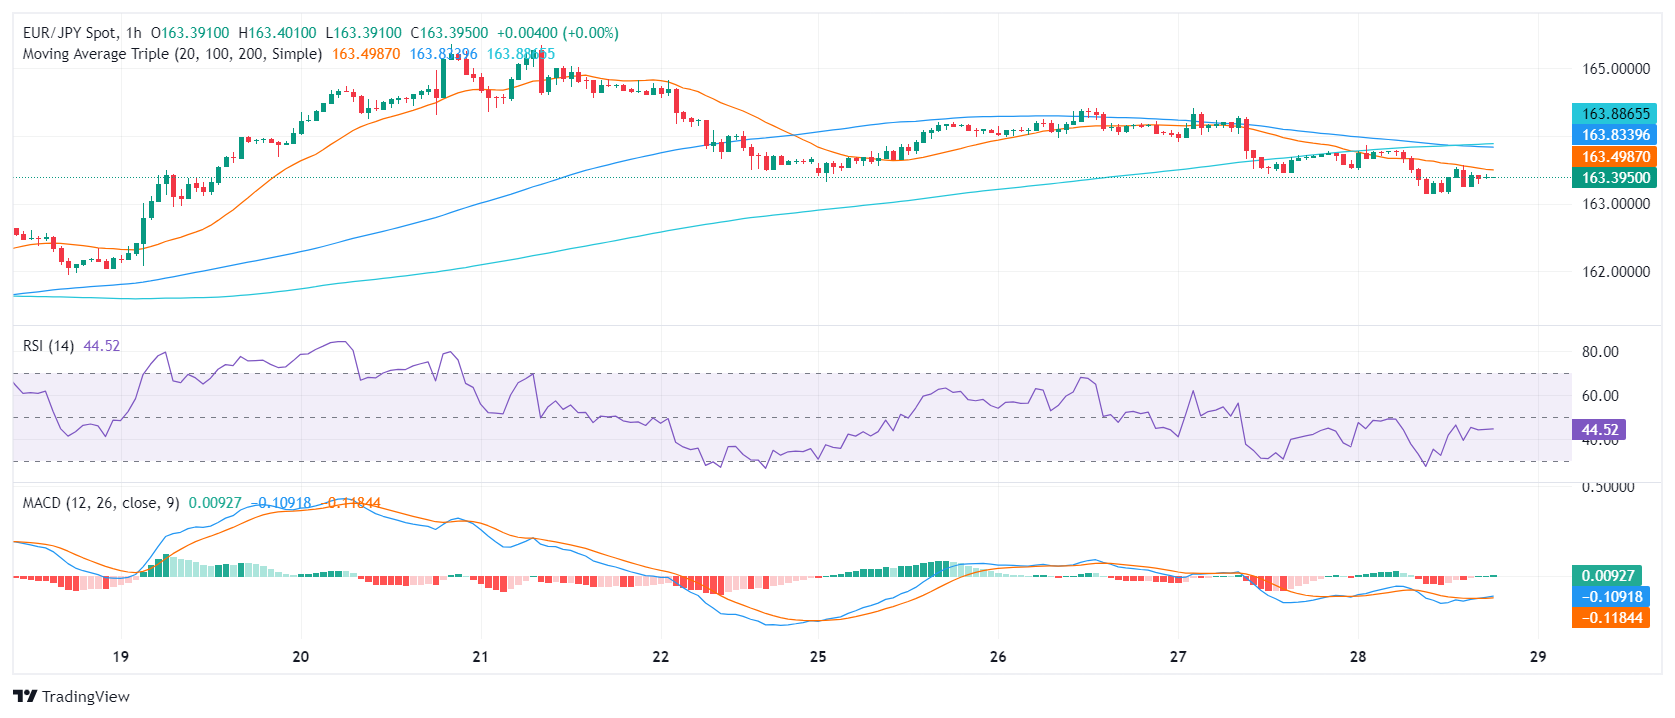
In conclusion, despite the negative sentiment on the hourly chart, the daily and broader metrics suggest that bulls maintain control of the bigger picture. The main task fo the buyers is to defend the 20-day SMA at around 163.00 and as long as the pair remains above this level, the outlook will be positive.


© 2000-2026. All rights reserved.
This site is managed by Teletrade D.J. LLC 2351 LLC 2022 (Euro House, Richmond Hill Road, Kingstown, VC0100, St. Vincent and the Grenadines).
The information on this website is for informational purposes only and does not constitute any investment advice.
The company does not serve or provide services to customers who are residents of the US, Canada, Iran, The Democratic People's Republic of Korea, Yemen and FATF blacklisted countries.
Making transactions on financial markets with marginal financial instruments opens up wide possibilities and allows investors who are willing to take risks to earn high profits, carrying a potentially high risk of losses at the same time. Therefore you should responsibly approach the issue of choosing the appropriate investment strategy, taking the available resources into account, before starting trading.
Use of the information: full or partial use of materials from this website must always be referenced to TeleTrade as the source of information. Use of the materials on the Internet must be accompanied by a hyperlink to teletrade.org. Automatic import of materials and information from this website is prohibited.
Please contact our PR department if you have any questions or need assistance at pr@teletrade.global.
transfers