- Analytics
- News and Tools
- Market News
- GBP/JPY Price Analysis: Consolidates around 191.00 amid thin liquidity conditions
GBP/JPY Price Analysis: Consolidates around 191.00 amid thin liquidity conditions
- GBP/JPY hovers around 191.00, reflecting market caution ahead of Japanese unemployment and industrial production updates.
- Wall Street ends Q1 on a mixed note, with UK's recession confirmation and vigilance over JPY's weakness influencing sentiment.
- Technical analysis suggests potential for movement if GBP/JPY breaches key levels, with 192.00 and 193.00 as notable targets.
The GBP/JPY barely moved on Thursday amid thin liquidity conditions and is hovering around 191.00, virtually unchanged as Friday’s Asian session begins.
Wall Street posted a stellar first quarter of 2024, with the S&P 500 and the Dow Jones finishing in the green. The outlier was the Nasdaq Composite, which dropped 0.12% in the last trading day of Q1.
In addition, economic data from the UK showed that Britain’s economy hit a technical recession, as expected by the market consensus. In Japan, authorities remain vigilant about the Japanese Yen's (JPY) weakness, which sent the USD/JPY rallying near 152.00.
As the Asian session begins, the Japanese economic docket will reveal the unemployment rate for February, which is expected to remain at 2.4%. At the same time, Industrial Production figures for the same month are expected to rise from -6.7% MoM to 1.4%, while Retail Sales are foreseen to expand by 3%.
GBP/JPY Price Analysis: Technical outlook
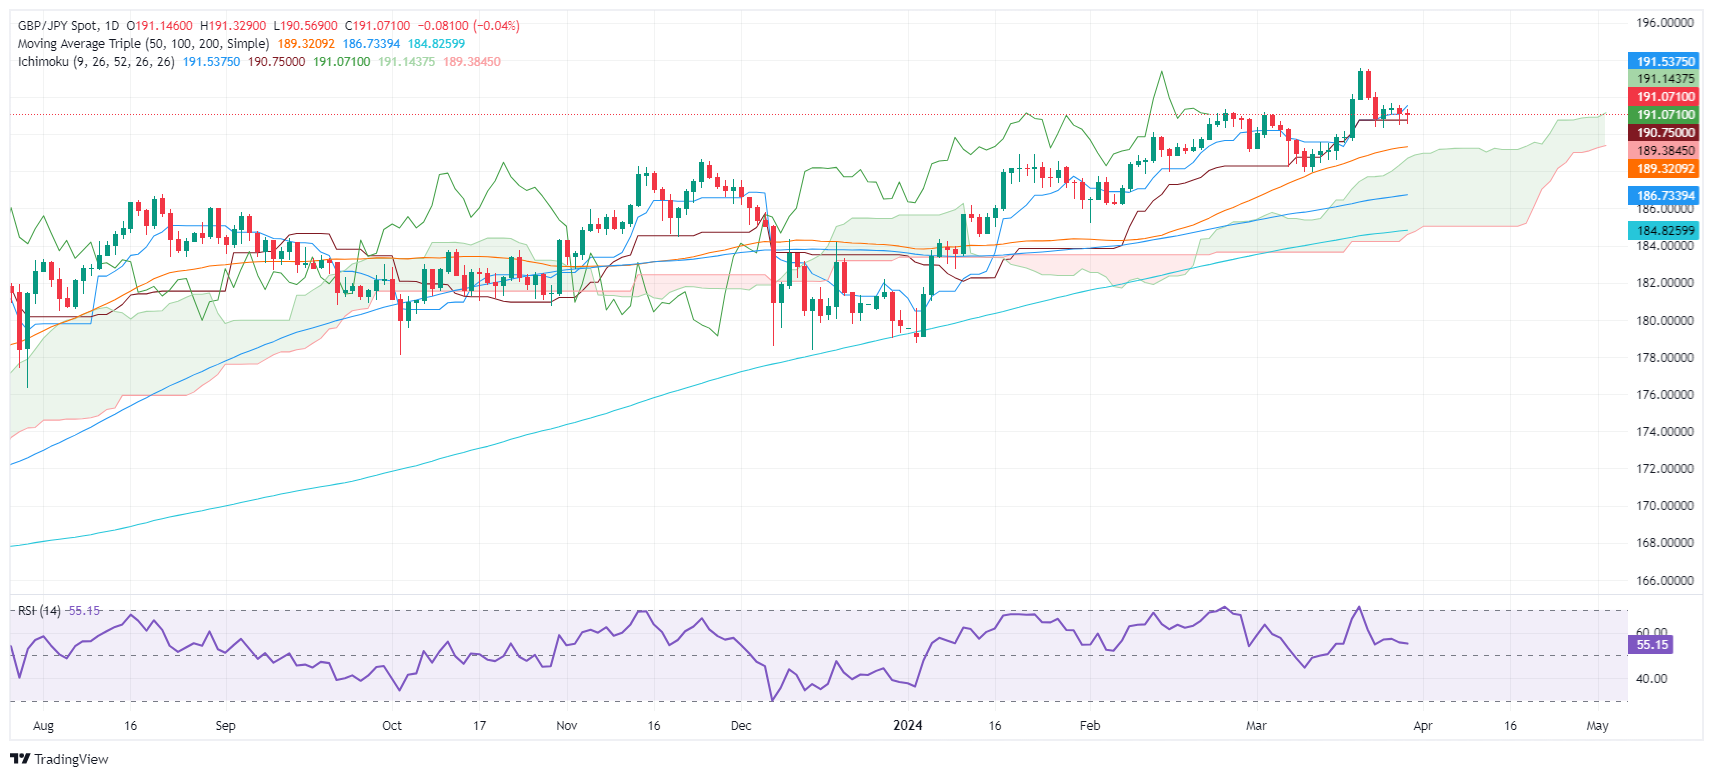
The GBP/JPY is subdued as liquidity conditions tumble. If buyers regain control, they must push prices above the Tenkan-Sen level at 191.57, which could open the door to challenge 192.00. Further upside is seen at 193.00, followed by the year-to-date (YTD) high at 193.53
On the flip side, if the pair drops below 191.00, that would pave the way for further losses. The next support would be the Kijuin-Sen at 190.74, followed by the 190.00 mark.
GBP/JPY Price Action – Daily Chart
© 2000-2026. All rights reserved.
This site is managed by Teletrade D.J. LLC 2351 LLC 2022 (Euro House, Richmond Hill Road, Kingstown, VC0100, St. Vincent and the Grenadines).
The information on this website is for informational purposes only and does not constitute any investment advice.
The company does not serve or provide services to customers who are residents of the US, Canada, Iran, The Democratic People's Republic of Korea, Yemen and FATF blacklisted countries.
Making transactions on financial markets with marginal financial instruments opens up wide possibilities and allows investors who are willing to take risks to earn high profits, carrying a potentially high risk of losses at the same time. Therefore you should responsibly approach the issue of choosing the appropriate investment strategy, taking the available resources into account, before starting trading.
Use of the information: full or partial use of materials from this website must always be referenced to TeleTrade as the source of information. Use of the materials on the Internet must be accompanied by a hyperlink to teletrade.org. Automatic import of materials and information from this website is prohibited.
Please contact our PR department if you have any questions or need assistance at pr@teletrade.global.


