- Analytics
- News and Tools
- Market News
- EUR/JPY Price Analysis: Bullish trend intact, as long as bulls defend the 20-day SMA
EUR/JPY Price Analysis: Bullish trend intact, as long as bulls defend the 20-day SMA
- Indicators on the daily chart show a steady buying momentum.
- Bulls need to maintain control over the current support around the 20-day SMA to avoid additional losses.
- Hourly chart indicators show signs of recovery.
The EUR/JPY pair is currently oscillating around the 163.20 mark, showing a slight increase in Tuesday’s session. The persisting momentum suggests an upper hand for the bulls, but if the pair falls below the 20-day Simple Moving Average (SMA), there may be a likelihood for sellers to force a momentum shift.
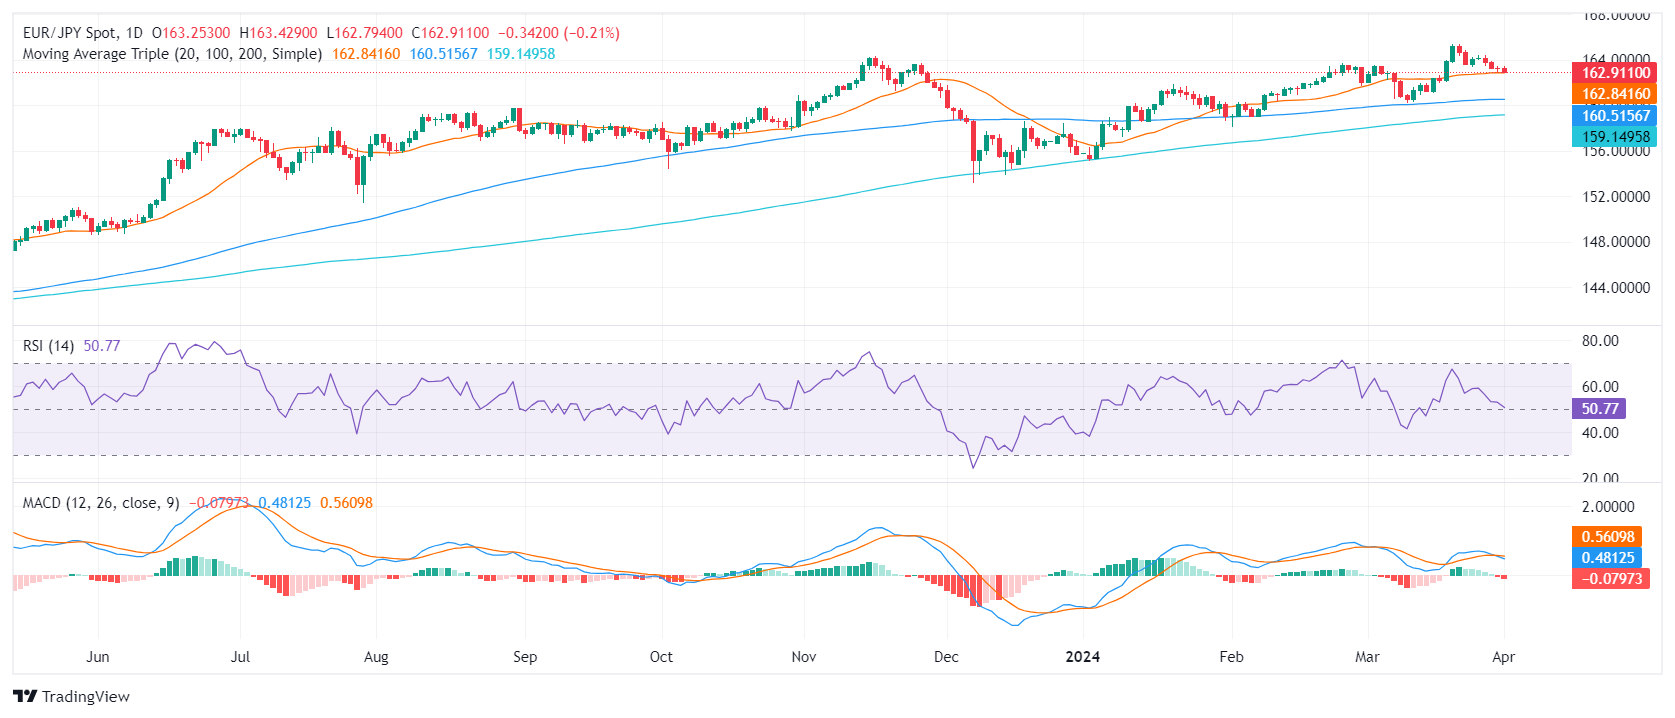
On the daily chart, the EUR/JPY pair has a mildly positive outlook. The Relative Strength Index (RSI) fluctuates in the positive territory, peaking at 65 last week before slipping to 52 in the most recent reading. The Moving Average Convergence Divergence (MACD) continues to print flat red bars, indicating a slightly negative momentum.
EUR/JPY daily chart
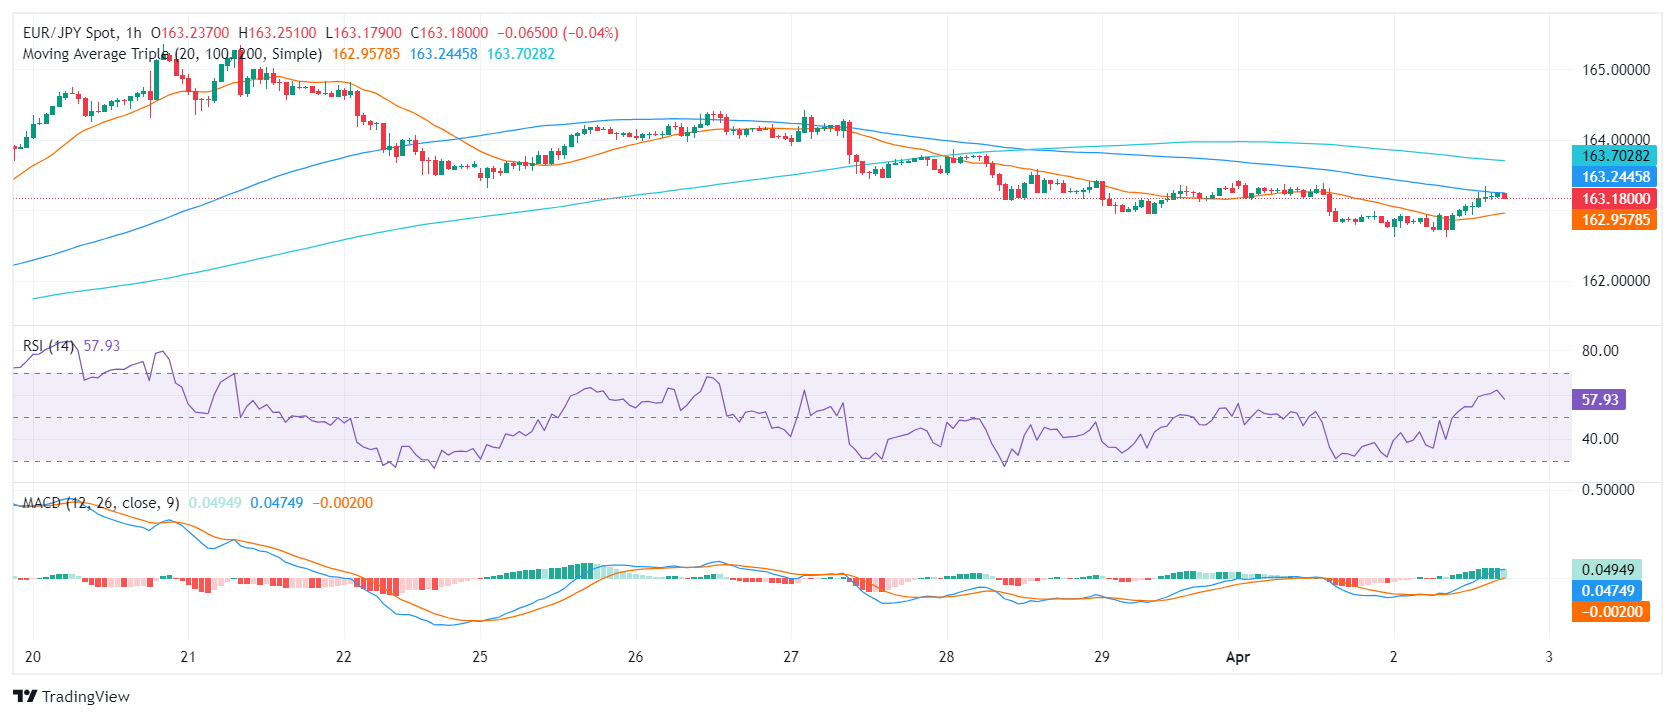
Switching to the hourly chart, the sentiment also leans towards positivity. The RSI, which started the session from a low point in negative territory at 39, has since recovered strongly to the positive territory with the most recent reading at 61. Reinforcing this positive trend, the MACD histogram prints green bars.
EUR/JPY hourly chart
In summary, the EUR/JPY pair is demonstrating an overall upward bias amidst minor setbacks. Both the daily and hourly charts portray a positive sentiment, as indicated by the RSI and MACD values. Along with the pair standing above its 20,100 and 200-day SMA, the overall market inclination leans towards the bulls.


© 2000-2026. All rights reserved.
This site is managed by Teletrade D.J. LLC 2351 LLC 2022 (Euro House, Richmond Hill Road, Kingstown, VC0100, St. Vincent and the Grenadines).
The information on this website is for informational purposes only and does not constitute any investment advice.
The company does not serve or provide services to customers who are residents of the US, Canada, Iran, The Democratic People's Republic of Korea, Yemen and FATF blacklisted countries.
Making transactions on financial markets with marginal financial instruments opens up wide possibilities and allows investors who are willing to take risks to earn high profits, carrying a potentially high risk of losses at the same time. Therefore you should responsibly approach the issue of choosing the appropriate investment strategy, taking the available resources into account, before starting trading.
Use of the information: full or partial use of materials from this website must always be referenced to TeleTrade as the source of information. Use of the materials on the Internet must be accompanied by a hyperlink to teletrade.org. Automatic import of materials and information from this website is prohibited.
Please contact our PR department if you have any questions or need assistance at pr@teletrade.global.
transfers