- Analytics
- News and Tools
- Market News
- GBP/JPY Price Analysis: GBP in command, investors may start taking profits
GBP/JPY Price Analysis: GBP in command, investors may start taking profits
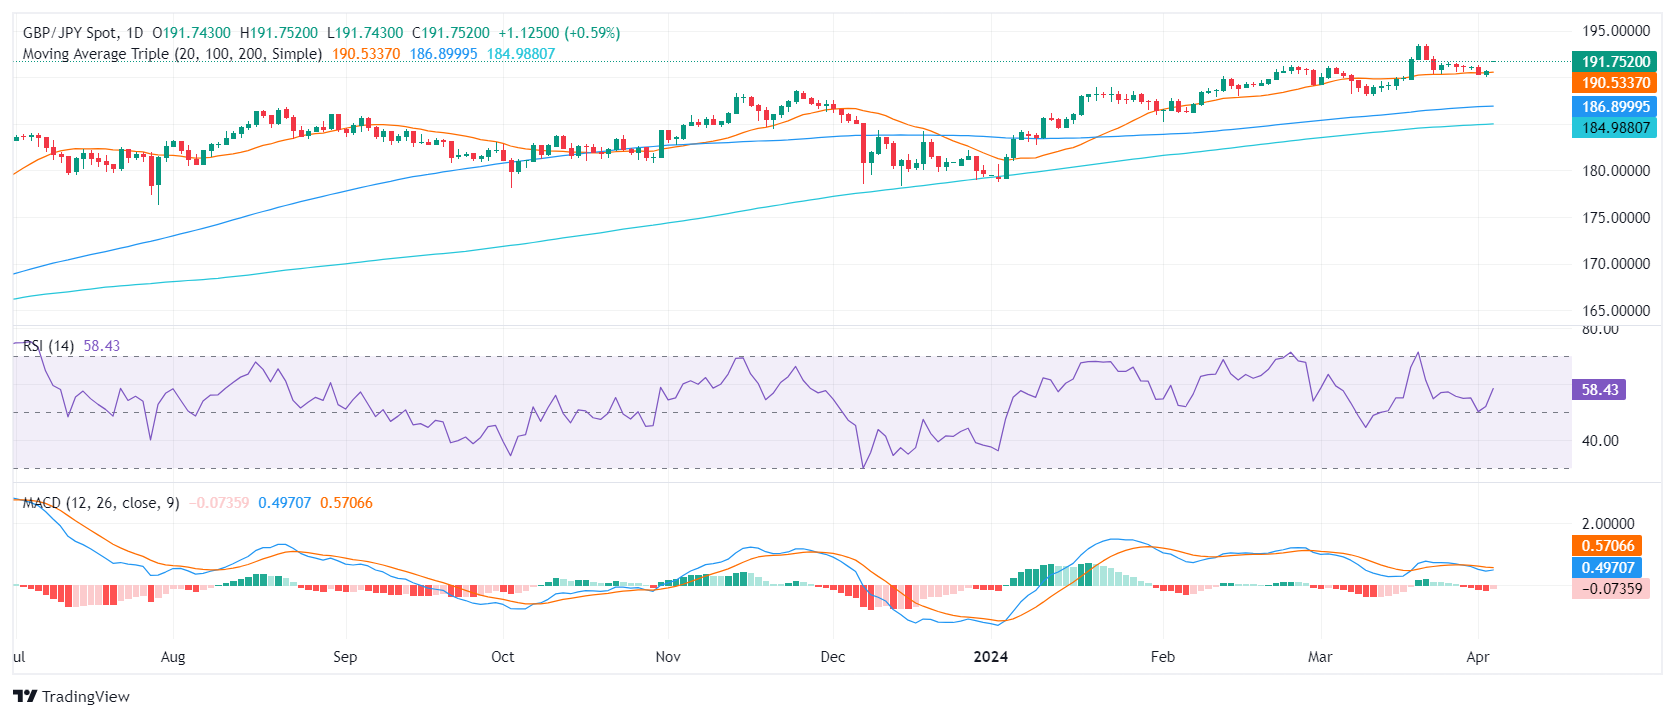
- The daily RSI on the GBP/JPY reveals a strong bullish posture, while the MACD shows a shift towards a more balanced market.
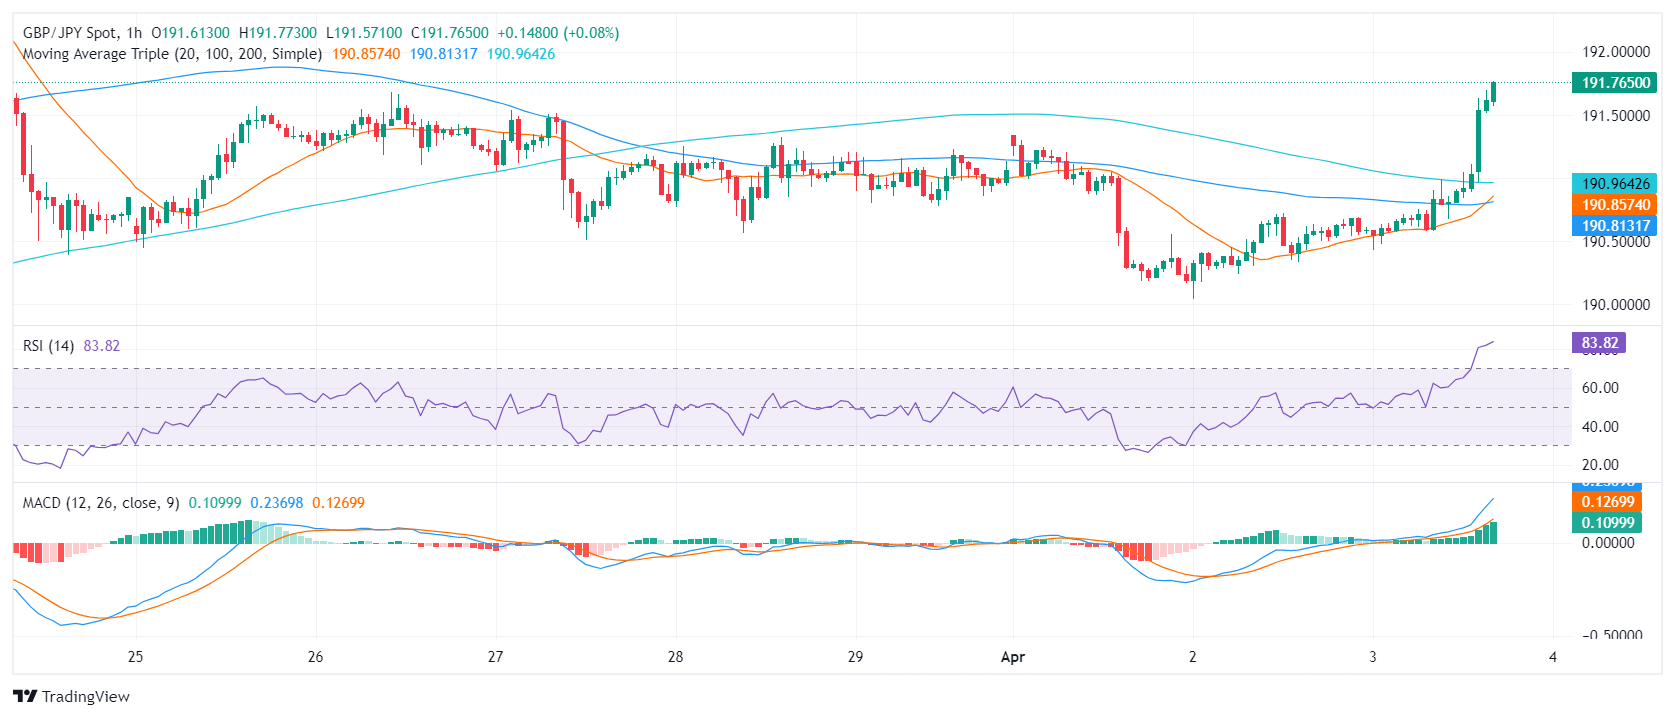
- The hourly chart discloses the RSI regularly exceeding overbought thresholds.
In Wednesday's session, the GBP/JPY is trading at the 191.65 level, showing a 0.57% uptick. The market sentiment for GBP/JPY is majorly bullish, but there is a high likelihood that investors may start taking profits as the cross reached overbought conditions on the hourly chart.
On the daily chart, the Relative Strength Index (RSI) pointing north above 50 indicates that buyers currently have a slight advantage in the market. While there are no extreme levels, suggesting overbought conditions, the RSI reveals a generally strong bullish posture. On the contrary, the Moving Average Convergence Divergence (MACD) is generating decreasing red bars, hinting at the presence of negative momentum and pointing toward more balanced market conditions.
GBP/JPY daily Chart
The hourly chart presents a contrasting perspective with the RSI logging higher values, lying deep in overbought terrain. This tends to predict a downward correction as the upward momentum may be overextended. In addition, the green rising bars of the MACD histogram also demonstrate positive momentum, reinforcing the strong presence of buyers in the market.
GBP/JPY hourly Chart
In terms of the overall trend, the GBP/JPY is positioned above its 20-day, 100-day, and 200-day SMAs. This pattern signals an enduring bullish trend in both short-term and long-term periods. In summary, while both the daily and hourly charts appear mostly bullish, the indicators reveal a stronger upward momentum in the hourly market with the possibility of a downward correction in the short term. However, as the pair holds above the main SMAs, the downward movements could be considered a mere correction.


© 2000-2026. All rights reserved.
This site is managed by Teletrade D.J. LLC 2351 LLC 2022 (Euro House, Richmond Hill Road, Kingstown, VC0100, St. Vincent and the Grenadines).
The information on this website is for informational purposes only and does not constitute any investment advice.
The company does not serve or provide services to customers who are residents of the US, Canada, Iran, The Democratic People's Republic of Korea, Yemen and FATF blacklisted countries.
Making transactions on financial markets with marginal financial instruments opens up wide possibilities and allows investors who are willing to take risks to earn high profits, carrying a potentially high risk of losses at the same time. Therefore you should responsibly approach the issue of choosing the appropriate investment strategy, taking the available resources into account, before starting trading.
Use of the information: full or partial use of materials from this website must always be referenced to TeleTrade as the source of information. Use of the materials on the Internet must be accompanied by a hyperlink to teletrade.org. Automatic import of materials and information from this website is prohibited.
Please contact our PR department if you have any questions or need assistance at pr@teletrade.global.
transfers