- Analytics
- News and Tools
- Market News
- EUR/JPY Price Analysis: Bullish stance holds strong, potential minor correction anticipated
EUR/JPY Price Analysis: Bullish stance holds strong, potential minor correction anticipated
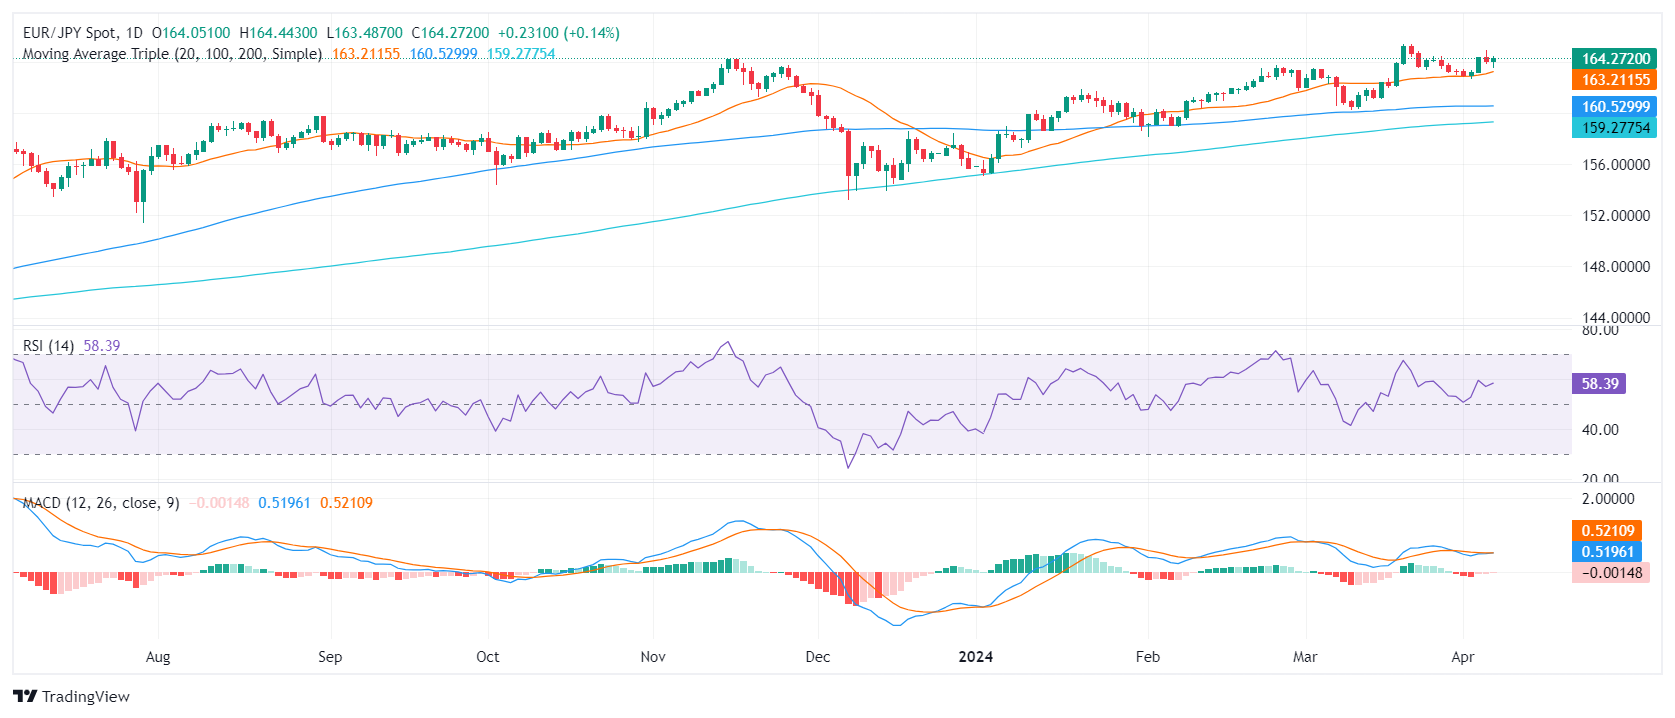
- The daily chart reveals an encouraging picture for the bulls, with the RSI close to 60.
- On the hourly chart, the indicators are weakening, but remain in a positive area.
- The cross operating above main SMAs, suggests a maintained bullish bias in both short-term and long-term contexts.
The EUR/JPY pair is currently exchanging hands at 164.24, registering a minor gain of 0.16%. Trading dynamics are steadily bullish, with buyers having a dominant influence over market actions. However, indicators are losing steam in the hourly chart.
The daily Relative Strength Index (RSI) reading, residing near 60, places the market in a positive territory and its consistent positive trend in the RSI, indicates that buyers maintain control over the market. Consistently, the Moving Average Convergence Divergence (MACD) presents an encouraging picture with decreasing red bars suggesting weak negative momentum.
EUR/JPY daily chart
Taking a look at the hourly chart, a similar tone of bullish dominance resounds but with indicators losing traction. The RSI values show a positive terrain, position between 40 and 60 during the most recent hours but point south. The MACD on the other hand, prints flat green bars, indicating a steady buying momentum.
EUR/JPY hourly chart

In the broader perspective, EUR/JPY maintains a significant bullish stance. Notably, the EUR/JPY stands above both the 20,100 and 200-day SMA, reaffirming a solid long-term bullish position and confirming the dominant upward movement shown by the RSI.
In conclusion, the comprehensive examination of EUR/JPY, considering both the daily and hourly charts, delivers a dual message. Buyers generally command the market, as illustrated by the upward RSI trend and the presence of green MACD bars. However, minor dips and slowdowns on the hourly chart imply occasional shifts in market dynamics toward sellers.


© 2000-2026. All rights reserved.
This site is managed by Teletrade D.J. LLC 2351 LLC 2022 (Euro House, Richmond Hill Road, Kingstown, VC0100, St. Vincent and the Grenadines).
The information on this website is for informational purposes only and does not constitute any investment advice.
The company does not serve or provide services to customers who are residents of the US, Canada, Iran, The Democratic People's Republic of Korea, Yemen and FATF blacklisted countries.
Making transactions on financial markets with marginal financial instruments opens up wide possibilities and allows investors who are willing to take risks to earn high profits, carrying a potentially high risk of losses at the same time. Therefore you should responsibly approach the issue of choosing the appropriate investment strategy, taking the available resources into account, before starting trading.
Use of the information: full or partial use of materials from this website must always be referenced to TeleTrade as the source of information. Use of the materials on the Internet must be accompanied by a hyperlink to teletrade.org. Automatic import of materials and information from this website is prohibited.
Please contact our PR department if you have any questions or need assistance at pr@teletrade.global.
transfers