- Analytics
- News and Tools
- Market News
- EUR/USD Price Analysis: Moves above 1.0850; next barrier at previous week’s high
EUR/USD Price Analysis: Moves above 1.0850; next barrier at previous week’s high
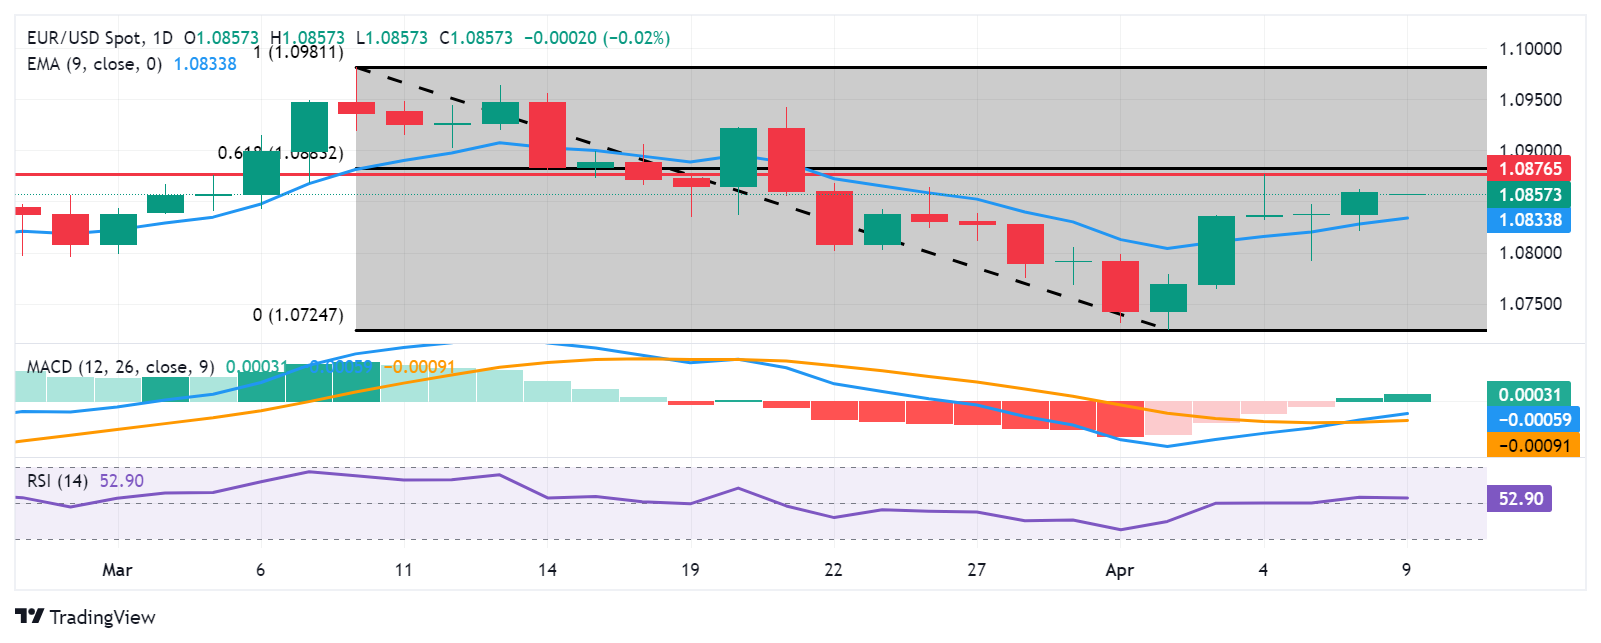
- EUR/USD could retest the previous week’s high of 1.0876.
- The resistance zone appears around the 61.8% Fibo level of 1.0883 and the psychological level of 1.0900.
- The major level of 1.0850 could act as a key support, followed by the nine-day EMA at 1.0833.
EUR/USD put efforts to continue its winning streak for the sixth successive session on Tuesday. The pair hovers around 1.0860 during the Asian session. In the daily-frame chart, the pair shows that it is taking support on the nine-day Exponential Moving Average (EMA), which suggests that the pair could move upward to retest the strong resistance at the previous week’s high at 1.0876.
Furthermore, the EUR/USD pair could explore the 61.8% Fibonacci retracement level of 1.0883, followed by the psychological level of 1.0900.
Additionally, technical analysis suggests a bullish sentiment for the EUR/USD pair. The 14-day Relative Strength Index (RSI) is positioned above the 50 mark, indicating strength in buying momentum.
The lagging indicator, Moving Average Convergence Divergence (MACD), shows a divergence above the signal line, which indicates gaining strength for the pair. However, it is still positioned below the centreline. So, the traders are likely to await MACD to offer a clear trend direction.
On the downside, the EUR/USD pair could find immediate support at the major level of 1.0850, followed by the nine-day EMA at 1.0833. A break below this level could lead the pair to navigate the region around the psychological level of 1.0800 following the previous week’s low at 1.0724.
EUR/USD: Daily Chart


© 2000-2026. All rights reserved.
This site is managed by Teletrade D.J. LLC 2351 LLC 2022 (Euro House, Richmond Hill Road, Kingstown, VC0100, St. Vincent and the Grenadines).
The information on this website is for informational purposes only and does not constitute any investment advice.
The company does not serve or provide services to customers who are residents of the US, Canada, Iran, The Democratic People's Republic of Korea, Yemen and FATF blacklisted countries.
Making transactions on financial markets with marginal financial instruments opens up wide possibilities and allows investors who are willing to take risks to earn high profits, carrying a potentially high risk of losses at the same time. Therefore you should responsibly approach the issue of choosing the appropriate investment strategy, taking the available resources into account, before starting trading.
Use of the information: full or partial use of materials from this website must always be referenced to TeleTrade as the source of information. Use of the materials on the Internet must be accompanied by a hyperlink to teletrade.org. Automatic import of materials and information from this website is prohibited.
Please contact our PR department if you have any questions or need assistance at pr@teletrade.global.
transfers