- Analytics
- News and Tools
- Market News
- EUR/USD Price Analysis: Holds above psychological level of 1.0600 amid a bearish sentiment
EUR/USD Price Analysis: Holds above psychological level of 1.0600 amid a bearish sentiment
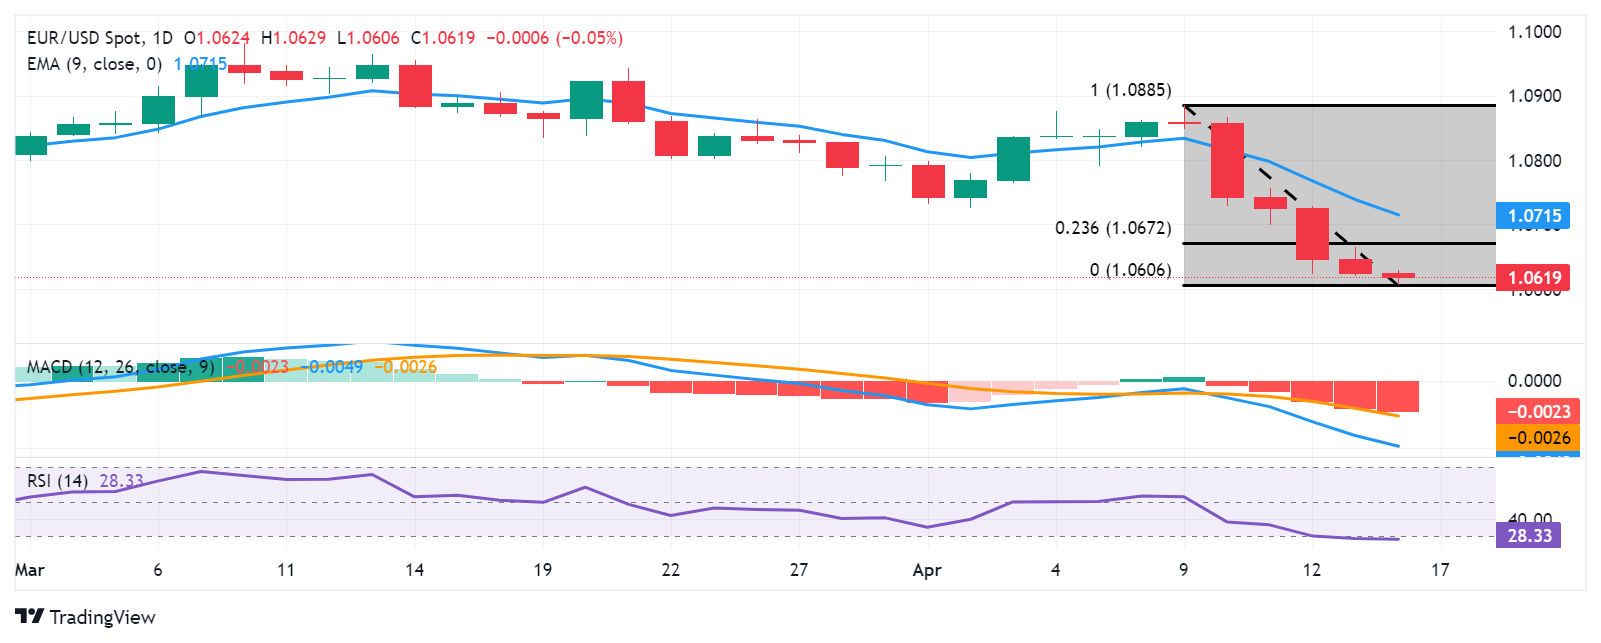
- EUR/USD could test the support at the psychological level of 1.0600.
- The pair could extend losses to November’s low at 1.0516 as Technical analysis suggests a bearish confirmation.
- The area around the major level of 1.0650 and the 23.6% Fibo level of 1.0672 appears as the resistance zone.
EUR/USD continues its losing streak for the sixth successive session on Tuesday, hovering near 1.0620 during the Asian trading hours. The US Dollar's (USD) strength put pressure on the EUR/USD pair, possibly driven by increased US Treasury yields. Additionally, stronger-than-anticipated Retail Sales data from the US has raised expectations that the Federal Reserve (Fed) might prolong its stance on higher interest rates.
On the technical side, the analysis suggests a bearish sentiment for the EUR/USD pair as the 14-day Relative Strength Index (RSI) is positioned below the 50 mark. Additionally, the lagging indicator, Moving Average Convergence Divergence (MACD), lies below the centreline and shows a divergence below the signal line, which indicates weakness for the pair.
The EUR/USD pair could find immediate support around the psychological level of 1.0600. A break below this level could exert downward pressure on the pair to navigate the region around the major level of 1.0550, followed by November’s low at 1.0516.
On the upside, the major level 1.0650 appears as the key barrier, followed by the 23.6% Fibonacci retracement level of 1.0672. A breakthrough above the latter could lead the EUR/USD pair to explore the area around the psychological level of 1.0700 and the nine-day Exponential Moving Average (EMA) at 1.0715.
EUR/USD: Daily Chart


© 2000-2026. All rights reserved.
This site is managed by Teletrade D.J. LLC 2351 LLC 2022 (Euro House, Richmond Hill Road, Kingstown, VC0100, St. Vincent and the Grenadines).
The information on this website is for informational purposes only and does not constitute any investment advice.
The company does not serve or provide services to customers who are residents of the US, Canada, Iran, The Democratic People's Republic of Korea, Yemen and FATF blacklisted countries.
Making transactions on financial markets with marginal financial instruments opens up wide possibilities and allows investors who are willing to take risks to earn high profits, carrying a potentially high risk of losses at the same time. Therefore you should responsibly approach the issue of choosing the appropriate investment strategy, taking the available resources into account, before starting trading.
Use of the information: full or partial use of materials from this website must always be referenced to TeleTrade as the source of information. Use of the materials on the Internet must be accompanied by a hyperlink to teletrade.org. Automatic import of materials and information from this website is prohibited.
Please contact our PR department if you have any questions or need assistance at pr@teletrade.global.
transfers